India's T&C Exports Fall 0.74% In Q1FY 2018-19
India's textile and clothing exports have witnessed a positive trade balance with growth of 0.17% to US$ 11358.31 million in the first quarter (Q1) of FY 18-19 over the same quarter of the previous fiscal year. In the Q1 of FY 18-19, the exports of T&C stakes 84% share from the total T&C trade with value of US$ 9487.38 million. USA is the topmost export market for India's T&C goods. USA totalled an export value of US$ 2001.62 million in the Q1 FY 18-19 with a growth of 2.51% over the same quarter of the previous fiscal year. Woven apparel is the major commodity exported to USA with value of US$ 567.64 million, growth of 3.06%.
Whereas in the import segment, China is the leading sourcing destination for India's T&C imports. China exports to India totalled to US$ 642.02 million but perceived a negative growth of -10.30% in the Q1 FY 18-19 and the country stakes 34% share in India's T&C imports of the first quarter of this fiscal year. From China majorly textile fabrics was imported to India in the Q1 FY 18-19 with value of US$ 142.41 million, falling by -11.85%.
Exports
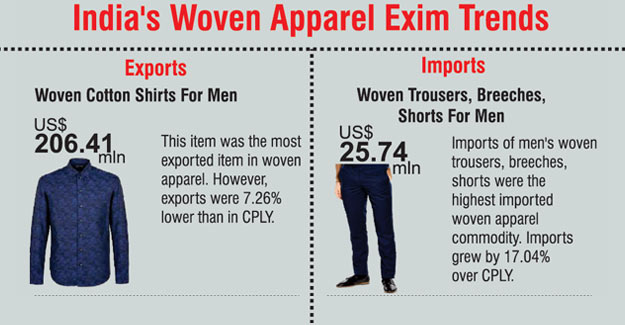
India's T&C exports in the Q1 FY 18-19 have witnessed a negligible drop of 0.74% in Q1 FY 18-19. The topmost commodity in the export segment is woven apparels with export value of US$ 2193.58 million, but the commodity has perceived a drop of 14.47% in the Q1 FY18-19 over the same quarter of the previous fiscal year. The commodity stakes 23% share from the total exports of T&C in the Q1 FY18-19. Woven apparel exports have witnessed the drop as demand from Afghanistan, Australia, Brazil, Bangladesh, etc., have fallen. Woven apparel exports to Afghanistan dropped by 39.97% to US$ 29.02 million in the first quarters of FY 18-19. In the same segment Australia has registered a drop of -15.05% to US$ 17.5 million and Brazil has perceived a negative growth of 11.15% to US$ 13.48 million. Exports to Bangladesh at US$ 12.2 million, registered a whopping decline of 54.16% in Q1 FY 18-19 over the same period of the previous fiscal year. USA was India's largest market for woven apparel during this quarter, with exports of US$ 567.64 million. Under this segment, men's or boy's shirts made from cotton were the most exported item, with a value of US$ 206.41 million, however, this was 7.26% lower than in the corresponding period of last year (CPLY). The item fetched an average unit value realisation of US$ 0.16 per piece.
Knitted fabrics exports have witnessed a growth of 43.59% to US$ 105.94 million in Q1 FY 18-19 over the same period in the previous fiscal. Bleached or unbleached knitted fabric of cotton was exported most in this segment with value of US$ 29.08 million.
Silk exports have shown a growth of 7.42% to US$ 20.86 million in Q1 FY 18-19 over the CPLY.
Carpets and other textile floor coverings exports registered a drop in the Q1 by 1.83% to US$ 420.70 million over the same quarters of the previous fiscal. But if compared between three months of the same quarter, the commodity has shown a growth of 11.9% in May 2018 compared to the previous month exports. In June 2018 the exports dropped by 2.29% over the May month exports.
In man-made staple fibre commodity, staple fibre made from polyester exports totaled US$ 83.38 million, growth of 39.09% in Q1 FY 18-19. Polyester staple fibre was exported at a price of US$ 0.79 per kg, whereas in the same quarter in previous fiscal the commodity was exported at rate of US$ 0.92 per kg. Fabrics of polyester staple fibre mainly mixed with viscose rayon staple fibre was second top exported commodity in MMSF segment in the Q1 FY 18-19 with an export value of US$ 72.72 million. This fabric was sold at a price of US$ 0.68 per metre in the Q1 FY 18-19 while the same fabric was sold at a price of US$ 0.78 per metre in the same quarter of the previous fiscal.
India's T&C markets
Country-wise, United State of America (USA) is the largest export market for India's textile and clothing products. In the first quarter of FY 18-19, exports to USA totalled US$ 2001.62 million with a growth of 2.51% and stakes 21% in India's T&C export for Q1 FY 18-19. In USA, India's apparel exports are ruling the basket with a stake of 52% from the total T&C exports to USA. India's apparel exports to the USA during the quarter totalled US$ 1040.38 million, growing by 6.10% of the CPLY. India's exports of carpets and other textile floor coverings have been in much demand in USA. The commodity has witnessed a growth of 2.58% in Q1 FY 18-19.
Surprisingly, Vietnam has become India's second largest export market for T&C. Exports to Vietnam during the quarter were to the tune of US$ 1776.61 million with a growth of 17.30%. Exports to Vietnam have increased mainly owing to increase in cotton exports which totalled to US$ 143.95 million in Q1 FY 18-19 over the previous fiscal year's export which totalled to US$ 92.72 million.
China is another important market for India's T&C exports, and mainly for Indian cotton. China has become India's fourth largest export market for T&C. India's exports to China went up by 190.04% in Q1 FY 18-19 with total of US$ 599.68 million. India's cotton was heavily exported to China in the quarter, making China the largest market for Indian cotton. India's cotton exports to China totalled to US$ 491.39 million with growth of 313.09% in Q1 FY 18-19 over the previous fiscal year.
T&C exports to UAE continue to fall. Exports went down by as much as 54.83% to US$ 653.43 million in Q1 FY 18-19 over the CPLY. But the country still remains the third largest export market for India's T&C goods. The country has witnessed a major drop in the apparel exports. Knitted apparels dropped by 62.83% and woven apparel by 57.94%.
With increased cotton exports to Pakistan, the country has emerged as an important market for India. India's T&C exports to Pakistan increased by 73.17% in the Q1 FY 18-19 totaling to US$ 196.96 million over the same quarter of the previous fiscal year.
India's T&C imports
India's T&C imports from the world in Q1 FY 18-19 registered a growth of 5.04% totaling to US$ 1870.93 million. The topmost commodity in this segment is man-made staple fibre (MMSF) with an import value of US$ 290.20 million with high growth of 65.02% in the Q1 FY 18-19 over the same quarter of the previous fiscal year. MMSF stakes 16% share from the total T&C imports in Q1 FY 18-19.
In MMSF, fabric made from polyester staple fibre was the maximum imported item in this commodity. The same fabric was imported at an average price of US$ 0.40 per metre in Q1 FY 18-19 whereas in the same period of the previous fiscal the average price was US$ 0.66 per metre. Staple fibre of polyester which was the second most imported item under this commodity was traded at an average price of US$ 0.71 per kg whereas in the previous fiscal year's same quarter the item was traded at an average price US$ 0.87 per kg.
Cotton imports stakes 15% share in this segment which totalled to US$ 289.17 million, but the commodity has perceived a negative growth of 25.47% in the Q1 FY18-19 over the same quarter of the previous fiscal year. USA is the topmost market for India's cotton import with a total of US$ 172.33 million. Raw cotton was imported at a price of US$ 0.46 per kg.
Man-made filament (MMF) was imported with a minimal growth of 4.39% to US$ 221.60 million in the Q1 FY 18-19 over the previous fiscal year. MMF stakes 12 % from the total T&C imports of India. Under this commodity, elastomeric items were traded the most with a value of US$ 31.13 million in Q1 FY 18-19 at an average price US$ 0.17 per unit. Another top item imported was high tenacity yarn of polyester and was traded at an average price of US$ 0.47 a unit.
Imports of carpets and other textile floor coverings witnessed a growth of 13.89% to US$ 30.67 million in the Q1 of FY 18-19. Nylon and other polyamides carpets were imported at a value of US$ 12.24 million, but have perceived a negative growth of 11.05%. The nylon and other polyamides carpets were traded at an average price of US$ 0.07 per sq. meter.
India's apparel imports have gone up significantly in this quarter against the previous year's same quarter. Woven apparel imports totalled US$ 195.70 million with a growth of 40.23% in Q1 FY 18-19. Bangladesh was the top exporter of woven apparel to India. The neighbouring country exported woven apparel worth US$ 43.82 million with a growth of 69.42%, during the quarter.
Under this commodity; trousers, breeches and shorts made of cotton for men were traded the most in India from the world. The imports totalled to US$ 25.74 million at average price of US$ 0.25 per piece in Q1 FY 18-19, whereas the same item was traded at an average price of US$ 0.49 per piece in the Q1 FY 17-18. Imports of woven shirts made of cotton for men were valued at US$ 13.49 million in Q1 FY 18-19 and per piece was traded at average price of US$ 0.13 per piece.
Knitted apparel imports totalled to US$ 83.65 million in Q1 FY 18-19 with growth of 31.77% over the previous fiscal same quarter. China is the leading exporter of knitted apparels to India. China exported knitted apparel worth US$ 36.48 million and perceived a growth of 15.20% in the Q1 FY 18-19.
T-shirts made of cotton, valued of US$ 10.70 million in the first quarter of FY 18-19 registered a growth of 23.21% over the previous fiscal same quarter. T-shirts were traded to India at an average price of US$ 0.71 per piece.
India's sourcing markets
Country-wise, China is the largest sourcing market for India's T&C goods. In Q1 FY 18-19, India imported T&C goods worth US$ 642.02 million from China, but witnessed a drop of 10.30% in the same period. A fall in imports from China is registered in many commodities - cotton imports went down by 25.47%, silk by 23.57%, knitted fabrics 14.28%, textile fabrics 3.09% and woven fabrics 1.86% in the Q1 FY 18-19 over the same period of the previous fiscal.
USA is the second largest T&C exporter to India, but imports from USA registered a fall of 4.17% during this quarter. India imported T&C goods worth US$ 215.35 million from USA during the quarter. Cotton is the major commodity imported from USA, but in Q1 cotton imports witnessed a drop of 5.27% to US$ 172.33 million over the same quarter of the previous fiscal year.
Imports from Bangladesh registered a growth of 39.77% to US$ 105.15 million in the Q1 FY 18-19. All the commodities have shown a good trend in the quarter except manmade filaments, nonwoven and special woven fabrics. Woven apparel was majorly exported to India from Bangladesh with value of US$ 43.82 million. Other important sourcing destinations include Egypt, Vietnam, Korea, Indonesia, Thailand and Taiwan.

Textile Excellence
Subscribe To Textile Excellence Print Edition
If you wish to Subscribe to Textile Excellence Print Edition, kindly fill in the below form and we shall get back to you with details.
Newsletter
Subscribe To Textile Excellence Mailing List


- December 09, 2022
'There Is Very High Acceptance For India

- December 09, 2022
'Advanced Machines & Service, Customer C

- October 09, 2023
First-time In The World: Rieter’s Auto

- October 31, 2023
Denge & Dyesol India: Leading The Way In

- June 01, 2020
Karl Mayer Enables Automated Production

- June 05, 2023
Ultimax - All New Revolutionary Rapier W

- June 09, 2025