China's PFY Export May Grow In H2 2022
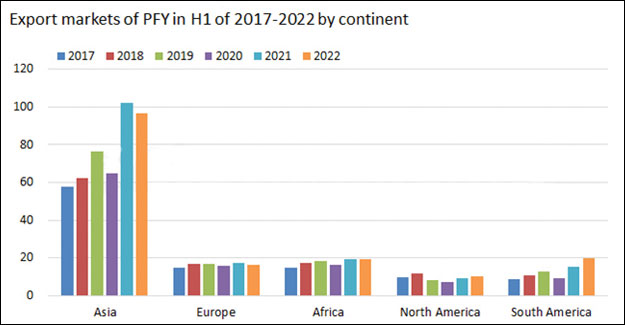
China's PFY exports amounted to 1,628kt in Jan-June, 2022, down 0.3% on the year, which were at 781kt in Q1, down 13.5% on annual basis, and at 847kt in Q2, up by 16.1% year on year. Exports surged in May and June. As for the second half of year, PFY export is likely to apparently increase in Q3 and Q4 of 2022. The total PFY exports are estimated to be at 3.15 million tons, a year-on-year rise of 5.1%. China’s PFY exports to Asia witnessed a fall. The proportion of Asia decreased to 59.4% from 62.4%, that of Europe and Africa inched down, and that of South America rose the most (especially Brazil), up to 12.1% from 9.4%, followed by North America. Exports of DTY outshined in the first half of 2022, with proportion up to around 50%, while those of POY and FDY witnessed negative growth. Export of POY decreased by nearly 30% year on year. It was cheaper to directly purchase DTY instead of buying POY this year. In addition, export increase mainly came from some garment processing nations (like Pakistan), while these regions are not integrated with DTY capacity, which further intensified the divergence of exported varieties.
| Top 10 export destinations of PFY in H1 of 2021 and 2022 (Unit: tons) | ||||
| Destination | H1 2021 | Proportion | H1 2022 | Proportion |
| Pakistan | 132660 | 8.10% | 175545 | 10.80% |
| Vietnam | 144945 | 8.90% | 154978 | 9.50% |
| Egypt | 142767 | 8.70% | 139764 | 8.60% |
| Brazil | 109783 | 6.70% | 138566 | 8.50% |
| Turkey | 157351 | 9.60% | 136653 | 8.40% |
| India | 217063 | 13.30% | 116478 | 7.20% |
| South Korea | 111529 | 6.80% | 105131 | 6.50% |
| Bangladesh | 78131 | 4.80% | 77850 | 4.80% |
| Indonesia | 54351 | 3.30% | 66589 | 4.10% |
| Mexico | 34073 | 2.10% | 47501 | 2.90% |
Textile Excellence
If you wish to Subscribe to Textile Excellence Print Edition, kindly fill in the below form and we shall get back to you with details.


