
India's T&C Exports Remain Sluggish In 2018
Apparel exports have dropped, while Indian cotton is booming in the international markets
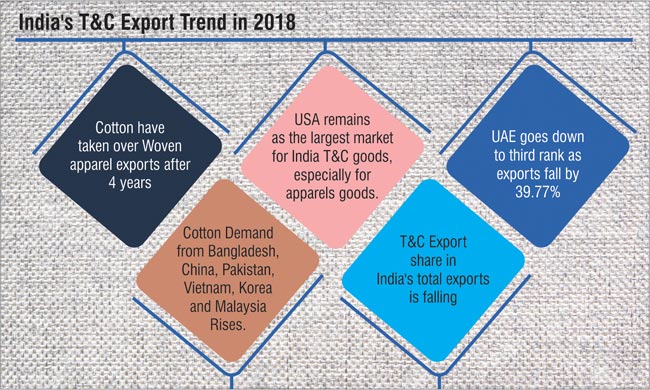
As per the data released by the Ministry of Commerce, government of India, India's textile and clothing (T&C) exports in 2018 remained sluggish. Exports witnessed a drop of 0.3% to US$ 37158.04 million in 2018 over the corresponding period and accounts for 11% share in the country's total exports for 2018, whereas for 2017 it was 12%, 2016 was 13% and 2015 was 14%.
Cotton exports have taken over knitwear and woven apparel individually, with an export value of US$ 8141.50 million and growth of 17.06% in 2018 over the corresponding period, making it the top commodity in the T&C export segment in 2018. If knit and woven apparel exports are accumulated together, apparel exports are dominating the sector, but it has perceived a negative growth of 9.47% in 2018 over the corresponding period.
 Commodity-wise exports
Men's t-shirts witness strong export growth
Woven apparels exports totaled to US$ 8131.48 million in 2018 with a negative growth of 9.53% in 2018 over the corresponding period and stakes a share of 22% in the country's total T&C exports. USA is the top export market for India's woven apparel exports. India's woven exports to USA totaled to US$ 2156.32 million and stakes 27% share in the total export of woven apparels of India.Woven exports to UAE have deteriorated last year by 46.41% to US$ 804.76 million over the corresponding period.
On average, woven apparels goods were traded at a price of US$ 1.69 per piece in 2018 over the corresponding period where the price was US$ 1.64/piece. In the woven apparel segment, men's shirts made of cotton remains the most exported item from India. The export value of the commodity totaled to US$ 789.67 million in 2018 over the corresponding period and it stakes 10% share in the woven apparel exports. Men's shirt made of cotton was traded at price of US$ 1.56 piece in 2018 while in 2017 the price was US$ 1.55 per piece. Men's shirt made of manmade fibre too has dropped by 60.65% to US$ 81.04 million in 2018 over the corresponding period where the exports totaled to US$ 205.87 million. The manmade fibre shirt for men was traded at a price of US$ 1.80 per piece last year, while in 2017 it was US$ 1.63 per piece.
Exports of brassieres have increased by 15.75% to US$ 107.22 million in 2018 over the corresponding period. The product was exported at a price of US$ 2.92 per piece last year, while in 2017 it was exported at US$ 3.28. Exports of babies garments made of cotton witnessed a drop of 8.47% to US$ 155.64 million in 2018 over the corresponding period. The garment was traded at US$ 2.50 per piece in 2018, while in 2017 per piece was traded at US$ 2.47.
Nightdresses and pyjamas of cotton, wool and other textile fibres have witnessed a positive growth in the export market. Nightdresses and pyjamas of wool have been exported in a very small quantity to the world from India. For cotton the growth was 13.05% to US$ 48.77 million, for wool it is 37.36% to US$ 0.09 million and for other textile fibres it is 21.17% to US$ 11.75 million in 2018 over the corresponding period. While the exports of nightdresses and pyjamas made from man-made fibre and silk perceived a negative growth of 43.82% and 61.80% respectively in 2018. For man-made fibre the exports totaled to US$ 35.63 million and for silk to US$ 0.27 million.
Nightdresses and pyjamas show interesting trade prices in the export market in 2018 and 2017. Cotton nightdresses and pyjamas were traded at a price of US$ 2.09 per piece in 2018, while in 2017 it was traded at US$ 1.84. For man-made fibres the garment was traded at US$ 1.88 per piece in 2018 and in 2017 it was US$ 1.49 per piece. For silk it was US$ 0.49 and US$ 0.70 per piece in 2018 and 2017 respectively. For wool it was US$ 0.42 per piece in 2018 and in 2017 it was US$ 0.57 per piece, while for other textile fibres it was traded at US$ 1.72 per piece in 2018 and US$ 1.60 per piece in 2017.Many other products exported under this segment have dropped last year over the corresponding period.
Knitted apparel exports too fell
Knitted apparels have also gone down by 9.41% to US$ 7,564.31 million in 2018 over the corresponding period, where the exports totaled to US$ 8,350.38 million. The commodity currently stakes 20% share in the total exports of India's T&C to the world. Here too USA is the top export market for India's knitted apparels products. Exports to USA totaled to US$ 1848.38 million with growth of 5.66% in 2018 over the corresponding period. In this category too, exports to UAE have dropped drastically, but has managed to stay as the second largest market to India for its knitted apparel goods. The exports of knitted apparels to UAE totaled to US$ 1095.68 million with a growth of 44.14%.
On a total average, knitted apparel products were exported to the world at price of US$ 3.19 per piece in 2018, while in 2017 it was US$ 2.94 per piece in 2017. Here t-shirt made of cotton where exported the most to the world in 2018 with growth of 4.31% to US$ 1787 million over the corresponding period. The product was traded at a cost of US$ 4.09 per piece in 2018, while in 2017 the cost was US$ 4.15 per piece. T-shirt made of fibres other than cotton registered a negative growth in its exports value. To detail it out, exports of t-shirt made of artificial fibre fell 12.68% to US$ 18.70 million in 2018 over the corresponding period, while for silk the growth declined by 31.18% to US$ 0.23 million. For t-shirt made of synthetic fibre the growth declined by to 56.6% to US$ 134.10 million and for other fibres the exports dropped by 22.26% to US$ 518.92 million in 2018 over the corresponding period.
Underpants and briefs made of synthetic fibre have witnessed an increase in its export value in 2018 over its corresponding period. The exports totaled to US$ 17.55 million with growth of 72.53%. The item was traded from India on average of US$ 6.42 per piece in 2018, while for 2017 it was US$ 5.01 per piece.
Sweaters and cardigans of wool exports have also witnessed a growth of 71.28% to US$ 33.07 million in 2018 over the corresponding period. Jersey made of cotton export too has shown a positive trend in the export market with US$ 171.66 million, growth of 28.71% in 2018 over the corresponding period.
India's cotton demand rises in Asia
There has been a good demand for Indian cotton in 2018 from Bangladesh, China, Pakistan, Vietnam, Korea and Malaysia. Cotton exports from India to the world registered a growth of 17.06% to US$ 8141.50 million in 2018 over the corresponding period, & cotton commodity stakes 22% share in the total T&C exports of India.
Cotton exports had a registered a fall in 2016 by 15.75%, after which in 2017 the exports of cotton had marginally picked up by 10.35%. Bangladesh remains the top export market for Indian cotton with an export value of US$ 2036.38 million in 2018, a growth of 17.06% over the corresponding period.
Indian cotton of staple length 28.5 MM and above but below 34.55 MM was exported the most to the world with a value of US$ 2136.90 million and growth of 32.97% in 2018 over the corresponding period. On an average per kg of this product was exported at US$ 5.23 in 2018, while in 2017 it was US$ 5.73.
Turkey increases its demand for Indian MMF
Exports of man-made filament (MMF) registered a growth of 6.76% in 2018 to US$ 2272.02 million over the corresponding period. Turkey is the top export market of India's MMF and the exports totaled to US$ 311.65 million with a growth of 3.42% in 2018 over the corresponding period. Textured yarn of polyester is the top product exported to the world under this segment and exports totaled to US$ 865.68 million in 2018 and a growth of 10.53% over the corresponding period and it was traded from India on average price of US$ 6 per kg, while in 2017 the price was US$ 6.86 per kg.
Exports of polyester yarn registered a minimal growth of 1.65% to US$ 140.22 million in 2018 over the corresponding period and is the second top exported product under the segment. This product was exported by Indian manufacturers at rate of US$ 7.37 per kg in 2018 and in 2017 it was US$ 8.65 per kg. Other yarn of polyester also registered a positive growth of 20.55% to US$ 134.64 million in 2018.
Exports of MMSF fell in 2018
India's man-made staple fibre (MMSF) exports registered a negative growth of 10.78% to US$ 1914.63 million in 2018 over the corresponding period. The commodity stakes 5% share in the total exports of India's T&C in 2018. Here Turkey is the top export market with an export value of US$ 199.48 million, but perceived a negative growth of 15.85% in 2018 over the corresponding period.
Under this commodity, staple fibre of polyester was exported the most from India in 2018. Exports of this product totaled to US$ 321.70 million with a growth of 31.37% over the corresponding period and on an average the product was traded at US$ 7.82 per kg in 2018, whereas in 2017, it was traded at US$ 8.96 per kg.Viscose rayon staple fibre, which is the fourth largest product exported under this commodity, has dropped drastically by 44.25% to US$ 172.86 million in 2018 over the corresponding period where the exports were US$ 310.05 million. The product was traded at price of US$ 4.64 per kg in 2018 while in 2017 it was traded at US$ 4.72 per kg.
Knitted fabric exports rise
Knitted fabrics exports from India to the world registered a growth of 31.31% to US$ 420.21 million in 2018 over the corresponding period. Here Sri Lanka is the top market, exports to Sri Lanka totaled to US$ 168.98 million with a growth of 32.92% in 2018 and stakes 40% share in the total exports of knitted fabrics from India.
The top product exported under this commodity from India to the world in 2018 was other knitted fabrics of cotton (unbleached / bleached) which totaled to US$ 118.20 million with growth of 29.96% over the corresponding period. The product was exported at a price of US$ 2.86 per kg, while in 2017 the product was traded at a price of US$ 2.99 per kg.
Silk, wool, carpets & other textile flooring exports
Silk exports have marginally gone up by 7.76% to US$ 82.58 million in 2018 over the corresponding period. In 2017 and 2016 the exports of silk has witnessed a fall of 15.49% and 18.50% respectively. USA is the top market of Indian silk, the exports of this commodity totaled to US$ 19.25 million with a growth of 35.48% in 2018 over the corresponding period.
Exports of wool too have registered a positive growth of 16.59% to US$ 188.30 million in 2018 over the corresponding period. Wools exports in 2018 have been the highest in the last 7 years exports of wool. Under this commodity, worsted weaving yarn was exported the most to the world from India, with totaled of US$ 79.08 million and a growth of 39.81% in 2018 over the corresponding period.
The exports of carpets and other textile flooring registered a negative growth of 0.23% to US$ 1749.44 million in 2018 over the corresponding period. The commodity stakes 5% share from the total T&C exports of India. USA is the top exports market too for this product, the exports totaled to US$ 918.42 million with growth of 10.04% in 2018 over the corresponding period.
India's Top T&C Exports Markets
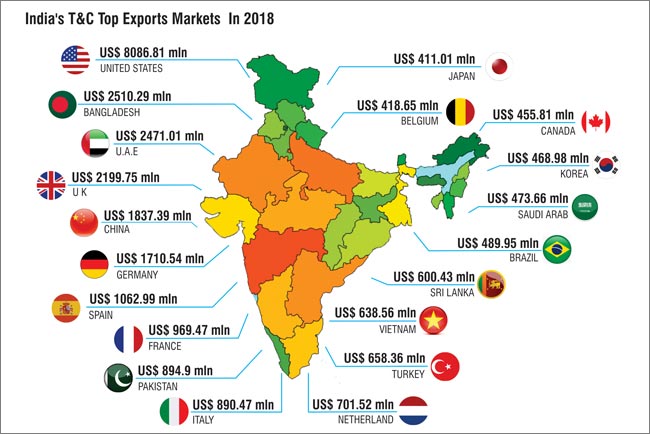
Country-wise, United States of America (USA) remains the largest export market for India's textile and clothing goods. In 2018, the T&C exports of USA totaled to US$ 8086.81 million with a growth of 4.01% and stakes 22% share in the total T&C exports of India. India's apparel exports to USA are ruling he basket with stake of 50% share in the total T&C exports to USA in 2018. Whereas in 2017 too, the share of the apparel exports the country was 50%, it was 51% in 2016. The apparel exports to USA totaled to US$ 4004.70 million in 2018 with growth of 3.53% over the corresponding period. Knitted t-shirt made of cotton has been the exported the most to USA from India, the exports totaled to US$ 391.69 million, but perceived a negative growth of 2.52% in 2018 over the corresponding period. Per knitted t-shirt was exported to USA at US$ 0.39 in 2018, while in 2017 it was exported at US$ 0.37.
Commodity-wise exports
Men's t-shirts witness strong export growth
Woven apparels exports totaled to US$ 8131.48 million in 2018 with a negative growth of 9.53% in 2018 over the corresponding period and stakes a share of 22% in the country's total T&C exports. USA is the top export market for India's woven apparel exports. India's woven exports to USA totaled to US$ 2156.32 million and stakes 27% share in the total export of woven apparels of India.Woven exports to UAE have deteriorated last year by 46.41% to US$ 804.76 million over the corresponding period.
On average, woven apparels goods were traded at a price of US$ 1.69 per piece in 2018 over the corresponding period where the price was US$ 1.64/piece. In the woven apparel segment, men's shirts made of cotton remains the most exported item from India. The export value of the commodity totaled to US$ 789.67 million in 2018 over the corresponding period and it stakes 10% share in the woven apparel exports. Men's shirt made of cotton was traded at price of US$ 1.56 piece in 2018 while in 2017 the price was US$ 1.55 per piece. Men's shirt made of manmade fibre too has dropped by 60.65% to US$ 81.04 million in 2018 over the corresponding period where the exports totaled to US$ 205.87 million. The manmade fibre shirt for men was traded at a price of US$ 1.80 per piece last year, while in 2017 it was US$ 1.63 per piece.
Exports of brassieres have increased by 15.75% to US$ 107.22 million in 2018 over the corresponding period. The product was exported at a price of US$ 2.92 per piece last year, while in 2017 it was exported at US$ 3.28. Exports of babies garments made of cotton witnessed a drop of 8.47% to US$ 155.64 million in 2018 over the corresponding period. The garment was traded at US$ 2.50 per piece in 2018, while in 2017 per piece was traded at US$ 2.47.
Nightdresses and pyjamas of cotton, wool and other textile fibres have witnessed a positive growth in the export market. Nightdresses and pyjamas of wool have been exported in a very small quantity to the world from India. For cotton the growth was 13.05% to US$ 48.77 million, for wool it is 37.36% to US$ 0.09 million and for other textile fibres it is 21.17% to US$ 11.75 million in 2018 over the corresponding period. While the exports of nightdresses and pyjamas made from man-made fibre and silk perceived a negative growth of 43.82% and 61.80% respectively in 2018. For man-made fibre the exports totaled to US$ 35.63 million and for silk to US$ 0.27 million.
Nightdresses and pyjamas show interesting trade prices in the export market in 2018 and 2017. Cotton nightdresses and pyjamas were traded at a price of US$ 2.09 per piece in 2018, while in 2017 it was traded at US$ 1.84. For man-made fibres the garment was traded at US$ 1.88 per piece in 2018 and in 2017 it was US$ 1.49 per piece. For silk it was US$ 0.49 and US$ 0.70 per piece in 2018 and 2017 respectively. For wool it was US$ 0.42 per piece in 2018 and in 2017 it was US$ 0.57 per piece, while for other textile fibres it was traded at US$ 1.72 per piece in 2018 and US$ 1.60 per piece in 2017.Many other products exported under this segment have dropped last year over the corresponding period.
Knitted apparel exports too fell
Knitted apparels have also gone down by 9.41% to US$ 7,564.31 million in 2018 over the corresponding period, where the exports totaled to US$ 8,350.38 million. The commodity currently stakes 20% share in the total exports of India's T&C to the world. Here too USA is the top export market for India's knitted apparels products. Exports to USA totaled to US$ 1848.38 million with growth of 5.66% in 2018 over the corresponding period. In this category too, exports to UAE have dropped drastically, but has managed to stay as the second largest market to India for its knitted apparel goods. The exports of knitted apparels to UAE totaled to US$ 1095.68 million with a growth of 44.14%.
On a total average, knitted apparel products were exported to the world at price of US$ 3.19 per piece in 2018, while in 2017 it was US$ 2.94 per piece in 2017. Here t-shirt made of cotton where exported the most to the world in 2018 with growth of 4.31% to US$ 1787 million over the corresponding period. The product was traded at a cost of US$ 4.09 per piece in 2018, while in 2017 the cost was US$ 4.15 per piece. T-shirt made of fibres other than cotton registered a negative growth in its exports value. To detail it out, exports of t-shirt made of artificial fibre fell 12.68% to US$ 18.70 million in 2018 over the corresponding period, while for silk the growth declined by 31.18% to US$ 0.23 million. For t-shirt made of synthetic fibre the growth declined by to 56.6% to US$ 134.10 million and for other fibres the exports dropped by 22.26% to US$ 518.92 million in 2018 over the corresponding period.
Underpants and briefs made of synthetic fibre have witnessed an increase in its export value in 2018 over its corresponding period. The exports totaled to US$ 17.55 million with growth of 72.53%. The item was traded from India on average of US$ 6.42 per piece in 2018, while for 2017 it was US$ 5.01 per piece.
Sweaters and cardigans of wool exports have also witnessed a growth of 71.28% to US$ 33.07 million in 2018 over the corresponding period. Jersey made of cotton export too has shown a positive trend in the export market with US$ 171.66 million, growth of 28.71% in 2018 over the corresponding period.
India's cotton demand rises in Asia
There has been a good demand for Indian cotton in 2018 from Bangladesh, China, Pakistan, Vietnam, Korea and Malaysia. Cotton exports from India to the world registered a growth of 17.06% to US$ 8141.50 million in 2018 over the corresponding period, & cotton commodity stakes 22% share in the total T&C exports of India.
Cotton exports had a registered a fall in 2016 by 15.75%, after which in 2017 the exports of cotton had marginally picked up by 10.35%. Bangladesh remains the top export market for Indian cotton with an export value of US$ 2036.38 million in 2018, a growth of 17.06% over the corresponding period.
Indian cotton of staple length 28.5 MM and above but below 34.55 MM was exported the most to the world with a value of US$ 2136.90 million and growth of 32.97% in 2018 over the corresponding period. On an average per kg of this product was exported at US$ 5.23 in 2018, while in 2017 it was US$ 5.73.
Turkey increases its demand for Indian MMF
Exports of man-made filament (MMF) registered a growth of 6.76% in 2018 to US$ 2272.02 million over the corresponding period. Turkey is the top export market of India's MMF and the exports totaled to US$ 311.65 million with a growth of 3.42% in 2018 over the corresponding period. Textured yarn of polyester is the top product exported to the world under this segment and exports totaled to US$ 865.68 million in 2018 and a growth of 10.53% over the corresponding period and it was traded from India on average price of US$ 6 per kg, while in 2017 the price was US$ 6.86 per kg.
Exports of polyester yarn registered a minimal growth of 1.65% to US$ 140.22 million in 2018 over the corresponding period and is the second top exported product under the segment. This product was exported by Indian manufacturers at rate of US$ 7.37 per kg in 2018 and in 2017 it was US$ 8.65 per kg. Other yarn of polyester also registered a positive growth of 20.55% to US$ 134.64 million in 2018.
Exports of MMSF fell in 2018
India's man-made staple fibre (MMSF) exports registered a negative growth of 10.78% to US$ 1914.63 million in 2018 over the corresponding period. The commodity stakes 5% share in the total exports of India's T&C in 2018. Here Turkey is the top export market with an export value of US$ 199.48 million, but perceived a negative growth of 15.85% in 2018 over the corresponding period.
Under this commodity, staple fibre of polyester was exported the most from India in 2018. Exports of this product totaled to US$ 321.70 million with a growth of 31.37% over the corresponding period and on an average the product was traded at US$ 7.82 per kg in 2018, whereas in 2017, it was traded at US$ 8.96 per kg.Viscose rayon staple fibre, which is the fourth largest product exported under this commodity, has dropped drastically by 44.25% to US$ 172.86 million in 2018 over the corresponding period where the exports were US$ 310.05 million. The product was traded at price of US$ 4.64 per kg in 2018 while in 2017 it was traded at US$ 4.72 per kg.
Knitted fabric exports rise
Knitted fabrics exports from India to the world registered a growth of 31.31% to US$ 420.21 million in 2018 over the corresponding period. Here Sri Lanka is the top market, exports to Sri Lanka totaled to US$ 168.98 million with a growth of 32.92% in 2018 and stakes 40% share in the total exports of knitted fabrics from India.
The top product exported under this commodity from India to the world in 2018 was other knitted fabrics of cotton (unbleached / bleached) which totaled to US$ 118.20 million with growth of 29.96% over the corresponding period. The product was exported at a price of US$ 2.86 per kg, while in 2017 the product was traded at a price of US$ 2.99 per kg.
Silk, wool, carpets & other textile flooring exports
Silk exports have marginally gone up by 7.76% to US$ 82.58 million in 2018 over the corresponding period. In 2017 and 2016 the exports of silk has witnessed a fall of 15.49% and 18.50% respectively. USA is the top market of Indian silk, the exports of this commodity totaled to US$ 19.25 million with a growth of 35.48% in 2018 over the corresponding period.
Exports of wool too have registered a positive growth of 16.59% to US$ 188.30 million in 2018 over the corresponding period. Wools exports in 2018 have been the highest in the last 7 years exports of wool. Under this commodity, worsted weaving yarn was exported the most to the world from India, with totaled of US$ 79.08 million and a growth of 39.81% in 2018 over the corresponding period.
The exports of carpets and other textile flooring registered a negative growth of 0.23% to US$ 1749.44 million in 2018 over the corresponding period. The commodity stakes 5% share from the total T&C exports of India. USA is the top exports market too for this product, the exports totaled to US$ 918.42 million with growth of 10.04% in 2018 over the corresponding period.
India's Top T&C Exports Markets
Country-wise, United States of America (USA) remains the largest export market for India's textile and clothing goods. In 2018, the T&C exports of USA totaled to US$ 8086.81 million with a growth of 4.01% and stakes 22% share in the total T&C exports of India. India's apparel exports to USA are ruling he basket with stake of 50% share in the total T&C exports to USA in 2018. Whereas in 2017 too, the share of the apparel exports the country was 50%, it was 51% in 2016. The apparel exports to USA totaled to US$ 4004.70 million in 2018 with growth of 3.53% over the corresponding period. Knitted t-shirt made of cotton has been the exported the most to USA from India, the exports totaled to US$ 391.69 million, but perceived a negative growth of 2.52% in 2018 over the corresponding period. Per knitted t-shirt was exported to USA at US$ 0.39 in 2018, while in 2017 it was exported at US$ 0.37.
 India's T&C export to Bangladesh rose 9.52% in 2018 over the corresponding period with an export value of US$ 2471.01 million. Bangladesh stakes 7% share in the totalT&C exports of India. As India's T&C exports to UAE have dropped drastically, Bangladesh has turned to be the second largest export market for India;s T&C goods.Bangladesh has been importing a lot of Indian cotton in the recent years, making it the largest commodity to be exported from India. Indian cotton exports totaled to US$ 2036.38 million with a growth of 14.84% in 2018 over the corresponding period and it stakes 81% share in the total T&C exports to Bangladesh from India. Cotton of staple length 28.5 MM and above but below 34.5 MM was exported the most to Bangladesh from India, the exports of the same totaled to US$ 788.69 million with a growth of 10.80% in 2018 over the corresponding period.Man-made filament exports too have witnessed a rise by 55.66% to US$ 171.67 million in 2018 over the corresponding period. But man-made staple fibre exports to Bangladesh have registered a fall of 40.11% in 2018 to US$ 162.49 million.
UAE which was the second largest export market for India's T&C goods in 2017, has witnessed a major drop in 2018. Exports totaled to US$ 2471.01 million with negative growth of 39.77% in 2018 over the corresponding period and it stakes 7% in the total T&C exports of India. Apparel exports are ruling the basket in the UAE market with an export value of US$ 1900.44 million, but perceived a negative growth of 45.12% in 2018 over the corresponding period. Other commodities like silk, wool, cotton, man-made fibre, man-made staple fibre, textile fabrics and knitted fabrics have witnessed a drop in their respective exports to UAE. United Kingdom remains the fourth largest market for India's T&C exports. The exports value totaled to US$ 2471.01 million in 2018 over the corresponding period. The growth declined by 39.77% in 2018 over the previous period. Here too the apparel exports have been ruling the basket with an export value of US$ 1620.47 million with a negative growth of 3.83% in 2018 over the corresponding period. Carpet and others textile flooring which has been doing good in the UK market, has too perceived a negative growth of 3.45% to US$ 97.83 million in 2018 over the corresponding period. Cotton exports have gone up by 7.85% to US$ 23.92 million.
Exports to China have moved up and so has the rank. Currently China stands as the fifth largest market for India's T&C exports in 2018 with a value of US$ 1837.39 million and growth of 21.30% over the corresponding period. China shares 5% in the total T&C exports of India. China has always been importing a lot of Indian cotton and the commodity's exports have witnessed a rise by 27.46% to US$ 1463.67 million in 2018 over the corresponding period. Apparel exports to China also have increased by 22.97% to US$ 96.14 million in 2018 over the corresponding period. Carpets and other textile floor covering exports to China registered a growth of 3.68% in 2018 over the corresponding period with an export value of US$ 19.16 million.
Germany which stood in the top five exports market for India's T&C goods in 2017, perceived a negative growth of 4.18% in 2018 over the corresponding period. The T&C exports to Germany totaled to US$ 1710.54 million in 2018. Indian apparel exports are dominating in the Germany market, the export totaled to US$ 1153.68 million, but perceived a negative growth of 1.52% in 2018 over the corresponding period. Further bifurcating the apparel export, woven apparel registered a negative growth of 6.66% to US$ 482.35 million in 2018 over the corresponding period, while knitted apparel exports registered a positive growth of 2.54%to US$ 671.33 million in 2018. Cotton, Carpets and other textile floor covering, and textile fabrics, all three registered a negative growth of 10.85%, 34.73% and 14.14% in 2018 over the corresponding period. India's T&C exports to Spain too registered a marginal drop of 0.90% to US$ 1062.99 million in 2018 over the corresponding period. Spain stakes 3% share in the total exports of India T&C goods. Though apparel exports are dominating in the segment, the commodity has perceived a negative growth of 2.81% to US$ 795.97 million in 2018 over the corresponding period. The apparel exports have dropped largely due to the drop in knitted apparel export, which fell by 7.77% to US$ 274.15 million in 2018 over the corresponding period. Cotton exports to have dropped by 20.13% while MMF and MMSF have both increased 5.43% and 13.92% respectively in 2018 over the corresponding period.
The others countries in the top ten are France on the eight position with a growth of 1.96% to US$, followed Pakistan and Italy 32.77% and 4.42% respectively in 2018 over the corresponding period.
T&C exports to Vietnam have been picking up constantly, exports in 2018 increased by 25.08% to US$ 638.56 million over the corresponding period where the exports totaled to US$ 510.51 million as the demand for cotton has been increasing from Vietnam. Cotton Exports from India to the country totaled to US$ 510.64 million with growth of 30.24% in 2018 over the corresponding period. Even MMF and MMSF have witnessed a positive growth of 12.6% and 2.89% respectively in 2018 with total of US$ 50.06 million and US$ 48.29 million.
Also Read: India's T&C Imports Move Up 10.52% In 2018
India's T&C export to Bangladesh rose 9.52% in 2018 over the corresponding period with an export value of US$ 2471.01 million. Bangladesh stakes 7% share in the totalT&C exports of India. As India's T&C exports to UAE have dropped drastically, Bangladesh has turned to be the second largest export market for India;s T&C goods.Bangladesh has been importing a lot of Indian cotton in the recent years, making it the largest commodity to be exported from India. Indian cotton exports totaled to US$ 2036.38 million with a growth of 14.84% in 2018 over the corresponding period and it stakes 81% share in the total T&C exports to Bangladesh from India. Cotton of staple length 28.5 MM and above but below 34.5 MM was exported the most to Bangladesh from India, the exports of the same totaled to US$ 788.69 million with a growth of 10.80% in 2018 over the corresponding period.Man-made filament exports too have witnessed a rise by 55.66% to US$ 171.67 million in 2018 over the corresponding period. But man-made staple fibre exports to Bangladesh have registered a fall of 40.11% in 2018 to US$ 162.49 million.
UAE which was the second largest export market for India's T&C goods in 2017, has witnessed a major drop in 2018. Exports totaled to US$ 2471.01 million with negative growth of 39.77% in 2018 over the corresponding period and it stakes 7% in the total T&C exports of India. Apparel exports are ruling the basket in the UAE market with an export value of US$ 1900.44 million, but perceived a negative growth of 45.12% in 2018 over the corresponding period. Other commodities like silk, wool, cotton, man-made fibre, man-made staple fibre, textile fabrics and knitted fabrics have witnessed a drop in their respective exports to UAE. United Kingdom remains the fourth largest market for India's T&C exports. The exports value totaled to US$ 2471.01 million in 2018 over the corresponding period. The growth declined by 39.77% in 2018 over the previous period. Here too the apparel exports have been ruling the basket with an export value of US$ 1620.47 million with a negative growth of 3.83% in 2018 over the corresponding period. Carpet and others textile flooring which has been doing good in the UK market, has too perceived a negative growth of 3.45% to US$ 97.83 million in 2018 over the corresponding period. Cotton exports have gone up by 7.85% to US$ 23.92 million.
Exports to China have moved up and so has the rank. Currently China stands as the fifth largest market for India's T&C exports in 2018 with a value of US$ 1837.39 million and growth of 21.30% over the corresponding period. China shares 5% in the total T&C exports of India. China has always been importing a lot of Indian cotton and the commodity's exports have witnessed a rise by 27.46% to US$ 1463.67 million in 2018 over the corresponding period. Apparel exports to China also have increased by 22.97% to US$ 96.14 million in 2018 over the corresponding period. Carpets and other textile floor covering exports to China registered a growth of 3.68% in 2018 over the corresponding period with an export value of US$ 19.16 million.
Germany which stood in the top five exports market for India's T&C goods in 2017, perceived a negative growth of 4.18% in 2018 over the corresponding period. The T&C exports to Germany totaled to US$ 1710.54 million in 2018. Indian apparel exports are dominating in the Germany market, the export totaled to US$ 1153.68 million, but perceived a negative growth of 1.52% in 2018 over the corresponding period. Further bifurcating the apparel export, woven apparel registered a negative growth of 6.66% to US$ 482.35 million in 2018 over the corresponding period, while knitted apparel exports registered a positive growth of 2.54%to US$ 671.33 million in 2018. Cotton, Carpets and other textile floor covering, and textile fabrics, all three registered a negative growth of 10.85%, 34.73% and 14.14% in 2018 over the corresponding period. India's T&C exports to Spain too registered a marginal drop of 0.90% to US$ 1062.99 million in 2018 over the corresponding period. Spain stakes 3% share in the total exports of India T&C goods. Though apparel exports are dominating in the segment, the commodity has perceived a negative growth of 2.81% to US$ 795.97 million in 2018 over the corresponding period. The apparel exports have dropped largely due to the drop in knitted apparel export, which fell by 7.77% to US$ 274.15 million in 2018 over the corresponding period. Cotton exports to have dropped by 20.13% while MMF and MMSF have both increased 5.43% and 13.92% respectively in 2018 over the corresponding period.
The others countries in the top ten are France on the eight position with a growth of 1.96% to US$, followed Pakistan and Italy 32.77% and 4.42% respectively in 2018 over the corresponding period.
T&C exports to Vietnam have been picking up constantly, exports in 2018 increased by 25.08% to US$ 638.56 million over the corresponding period where the exports totaled to US$ 510.51 million as the demand for cotton has been increasing from Vietnam. Cotton Exports from India to the country totaled to US$ 510.64 million with growth of 30.24% in 2018 over the corresponding period. Even MMF and MMSF have witnessed a positive growth of 12.6% and 2.89% respectively in 2018 with total of US$ 50.06 million and US$ 48.29 million.
Also Read: India's T&C Imports Move Up 10.52% In 2018
Textile Excellence
Subscribe To Textile Excellence Print Edition
If you wish to Subscribe to Textile Excellence Print Edition, kindly fill in the below form and we shall get back to you with details.
Newsletter
Subscribe To Textile Excellence Mailing List


- December 09, 2022
'There Is Very High Acceptance For India

- December 09, 2022
'Advanced Machines & Service, Customer C

- October 09, 2023
First-time In The World: Rieter’s Auto

- October 31, 2023
Denge & Dyesol India: Leading The Way In

- June 01, 2020
Karl Mayer Enables Automated Production

- June 05, 2023
Ultimax - All New Revolutionary Rapier W

- June 09, 2025