India's T&C Imports Move Up 10.52% In 2018
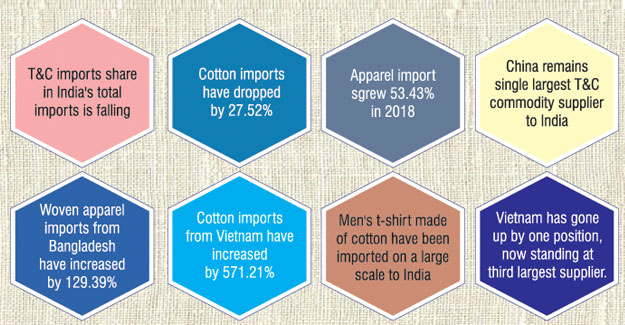
India's textile and clothing imports in 2018 registered a growth of 10.52% totalling to US$ 7320.50 million over the corresponding period as per the data release by the Ministry of Commerce of India. T&C imports account for 1% of the country's total imports for 2018. Whereas for 2017 too, the share of T&C imports was 1%, it was 2% in 2016. Cotton imports have been dominating the segment for a quite long time now, but as the demands for other country's cotton have increased, India's cotton imports have dropped, making apparel products the largest imported commodity to the country. India's apparel imports totalled to US$ 1057.58 million with a growth of 53.43% in 2018 over the corresponding period.
Countries-wise T&C Exports
China remains the top in supplier to India for T&C goods and dominates with a share of 39% in total T&C imports of India. China exported goods worth US$ 2857.94 million with a growth of 6.02% in 2018 over the corresponding period.
Textile fabrics is ruling the import basket from China to India with a total of US$ 549.95 million and growth of 4.37% in 2018 over the corresponding period. Cotton imports have reduced by 3.62% in 2018 to US$ 123.39 million. Woven apparel too witnessed a drop by 1.36% to US$ 110.03 million in 2018 over the corresponding period.
Knitted apparel imports increased by 28.52% to US$ 205.93 million. Imports of man-made filament, nonwoven and other made-ups of textile from China have witnessed an increase in the import value in 2018. Where man-made filament increased by 18.99% to US$ 421.33 million, imports of nonwovens increased by 26.84% to US$ 118.31 million and for other made-ups of textile, the imports increased by 19.88% to US$ 185.56 million in 2018 over the corresponding period.
USA is the second largest T&C supplier to India, but the country has lost its imports value by 15.62% to US$ 543.18 million in 2018 over the corresponding period and accounts a share of 7% in India's total T&C imports.
Cotton imports are ruling the basket, but the imports value has dropped down by 25.74% to US$ 356.60 million in 2018 over the corresponding period. Imports of textile fabrics have done well here, imports totalled to US$ 81.03% to US$ 20.84 million in 2018 over the corresponding period.
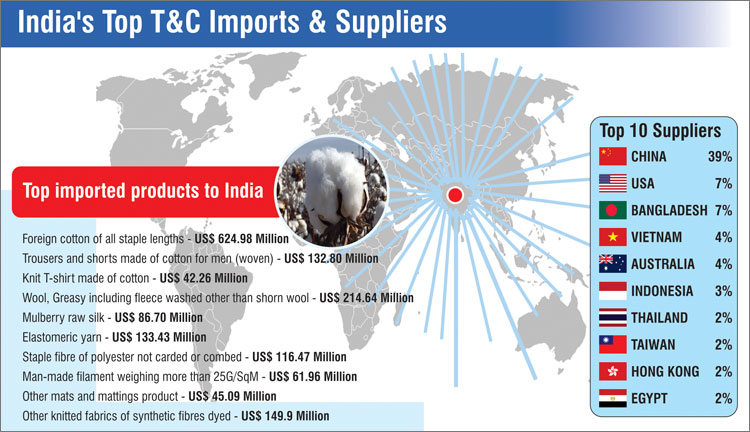 Bangladesh is the third largest T&C supplier to India and the imports totalled to US$ 537.67 million with a growth of 59.15% in 2018 over the corresponding period and Bangladesh accounts for 7% in the total T&C imports of India.The T&C imports from Bangladesh have increased due the huge demand for woven apparel. The woven apparel imports totalled to US$ 266.88 million with a growth of 129.39% in 2018 over the corresponding period. Other textile fibre which is second largest commodity imported from Bangladesh totalled to US$ 113.69 million, but perceived a negative growth of 7.35% in 2018 over the corresponding period. Cotton imports have increased marginally by 23.05% to US$ 21.26 million.
Vietnam, which was the fourth largest supplier to India in 2017 has increased its T&C imports to India by 24.50% in 2018 to US$ 299.9 million and now stands as the third largest supplier of T&C goods to India.
The country shares 4% in the total T&C imports of India. From Vietnam, man-made filament is largest commodity imported to India.
The imports of the commodity totalled to US$ 112.11 million with marginally growth of 0.84% in 2018 over the corresponding period. Cotton imports have perceived an outstanding growth of 571.21% to US$ 11.47 million in 2018. Textile fabrics too have perceived an exceptional growth of 168.15% to US$ 40.80 million in 2018.
India's T&C imports from Australia have dropped in 2018 by 18.74% to US$ 256.53 million over the corresponding period mainly due to drop in cotton imports, which registered a drop of 59.29% to US$ 57.50 million in 2018, whereas in the corresponding period the imports registered to US$ 141.25 million.
Australia lost its position by one, now standing as the fourth largest supplier to India for T&C goods. From Australia wool is the commodity majorly imported to India and ruling the import basket with a growth of 11.87% to US$ 202.96 million in 2018 over the corresponding period, where the imports totalled to US$ 181.42 million.
Imports from Indonesia too have witnessed a positive trend and demands have increased for T&C goods especially for MMSF.
The imports from the country to India totalled to US$ 232.48 million with a growth of 61.87% in 2018 over corresponding period and share a stake of 3% in the total T&C imports of India. Here manmade staple fibre is largest imported commodity to India with total imports of US$ 141.32 million with a growth of 100.60% in 2018 over the corresponding period.
Man-made filament import too have increased and is growing moderately y-o-y. The imports of MMF in 2018 witnessed a growth of 34.86% to US$ 36.09 million over the corresponding period. The other commodities to have perceived a positive trend on the import trade and is growing steadily.
The other top suppliers are Thailand, Taiwan, Hong Kong, and Egypt respectively. In 2017 Egypt stood as the 17th largest supplier to India, but is now among the top 10 suppliers list. Imports from Egypt totalled to US$ 160.57 million with a growth of 191.57% in 2018 over the corresponding period. Man-made staple fibre is ruling the import basket and perceived a growth of 50004.16% to US$ 80.72 million in 2018 over the corresponding period where the imports totalled to US$ 0.16 million. Cotton is second largest commodity to be imported with an value of 59.56% to US$ 76.03 million in 2018.
India's demand for world's cotton witnesses a fall
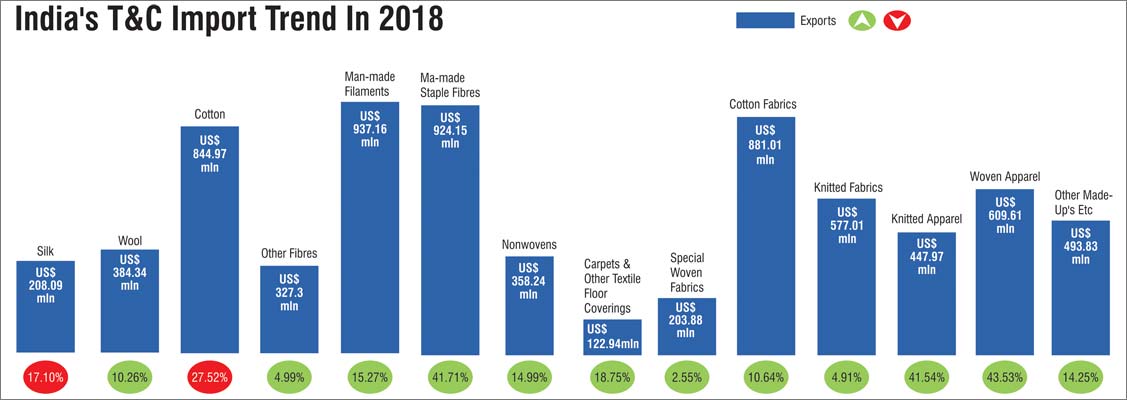
India's cotton imports have witnessed a drop by 27.52% to US% 844.97 million in 2018 over the corresponding period and the commodity stakes 12% share in the total T&C imports of India 2018. While in 2017, the commodity witnessed a positive growth of 8.35% to US$ 1165.76 million over the corresponding period. USA is the largest cotton supplier to India with import value of US$ 356.60 million, but perceived a negative growth of 25.74% in 2018 over the corresponding period.
Under this commodity, foreign cotton of all staple lengths has been imported the most from the world to India. The imports totalled to US$ 624.98 million with a growth of 35.26% in 2018 over the corresponding period and total quantity of 269775.15 Kgs of the commodity was imported to India. On an average, foreign cotton of all staple lengths was imported at an average price of US$ 0.43 per kg in 2018 while in 2017 it was US$ 0.46 per kg.
Cotton sarees of handloom have done well in 2018 imports. The imports of commodity totalled to US$ 12.53 million with growth of 39.63% over the corresponding period. Around 7271.22 sq. metres of saree of handloom was imported to India from the world in 2018 and on average the commodity was trade at US$ 0.58 per sq. metre in 2018, while in 2017 it was US$ 0.33 sq. metre.
Woven apparel imports up 63.53%
India's imports of woven apparel have registered a growth of 63.53% to US$ 609.61 million in 2018 over the corresponding period and the commodity accounts for 8% share in the total T&C imports of India. Bangladesh is the largest supplier of woven apparel to India, the imports of the commodity from Bangladesh totalled to US$ 266.88 million with growth of 129.39% in 2018. China is the second largest supplier of woven apparels to India, has lost it exports value to India by 1.36% to US$ 110.03 million in 2018 over the corresponding period.
Under this commodity, trousers and shorts made of cotton for men have been imported the most to the country from the world. The import value totalled to US$ 132.80 million with a growth of 64.86% in 2018 over the corresponding period. As per the statistics provided by the government, India imported around 26058 nos. of trousers and shorts from the world in 2018 and on average the product was traded in country at price of US$ 0.20 per piece, while in 2017 it was traded at US$ 0.34 per piece. While imports trousers and shorts made of synthetic fibre registered a splendid growth of 115.66% in 2018 to US$ 17.53 million over the corresponding period.
The quantity of this products increased by 122.99% in 2018 with a quantity of 2156 nos while in 2017 with was 967 nos. and on a average the product was imported to India at US$ 0.12 per piece in 2018 and 2017 too.
Men's shirts made cotton too have witnessed an excellent trend in the import segment, with a growth of 148.70% to US$ 90.65 million in 2018 over the corresponding period. The quantity of this product in 2018 has nearly gone up more than thrice the quantity that was imported in 2017. In 2018 imported quantity registered to 13222 nos., while in 2017 it was registered to be at 4099. Men's shirt made of cotton on average was traded at a price of US$ 0.15 per piece in 2018 while in 2017 it was traded at US$ 0.11 per piece.
Knit apparels imports up 41.54%
Imports of knit apparel to have witnessed a rise in 2018 by 41.54% to US$ 447.97 million over the corresponding period and commodity stakes 6% share in the total T&C imports of India. For knit apparels, China is the largest supplier to India with a growth of 28.52% to US$ 205.93 million in 2018. Indian buyers have been demanding for knitted apparels from Bangladesh, the imports from Bangladesh have increased by 85.36% in 2018 to US$ 76 million in 2018 over the corresponding period. Demands from Sri Lanka too have shown interesting trend in the import segment, the import from country to India registered a growth of 84.63% to US$ 28.81 million in 2018.
Under this commodity, t-shirt made of cotton have been largely supplied to India from the world, the imports of this commodity totalled to US$ 42.26 million with a growth of 36.16% in 2018 over the corresponding period.
Quantity wise the product has not jumped that high, in 2018 the quantity registered was 25558 nos while in 2018 with was 19232. On a average, t-shirt of cotton was trade at price of US$ 0.60 per piece while 2017 it was US$ 0.62 per piece.
T-shirt made of other textile material like synthetic fibre, artificial fibre, silk, wool and other textile fibre to have done well in the import segment. For Synthetic fibre the imports registered to US$ 19.18 million with a growth of 31.32%, while for artificial fibre the imports registered to US$ 3.39 million with growth of 40.6%.
For t-shirt made of silk imports totalled to US$ 0.02 million with an growth of 191.46% and for wool it was US$ 0.1 million with a growth of 342.37% and last of other fibres with imports totalled to US$ 7.3 million with growth of 24.76% in 2018 over the corresponding period.
In 2018 imports of babies garments made of cotton have witnessed an import of double the value that was registered in 2017. Last year imports totalled to US$ 14.41 million with a growth of 100.34% over the corresponding period.
In total around 2049 nos. of babies garment were imported from world to India. On average a garment was imported to India at rate of US$ 0.14 per piece in 2018 while in 2017 it was traded at US$ 0.20 per piece.
Other hosiery goods of synthetic fibres imports have registered an enormous growth of 456.07% in 2018 to US$ 8.54 million over the corresponding period. Quantity wise the commodity has been heavily imported to the country, it has witnessed a growth of 3586.36% in 2018 with quantity of 52542 pairs while in 2017 it was registered to be 1425 pairs that was imported to the country. On an average, the product was imported at a price of US$ 6.15 per pair in 2018, while in 2017 it was US$ 0.93 for a pair.
Bangladesh is the third largest T&C supplier to India and the imports totalled to US$ 537.67 million with a growth of 59.15% in 2018 over the corresponding period and Bangladesh accounts for 7% in the total T&C imports of India.The T&C imports from Bangladesh have increased due the huge demand for woven apparel. The woven apparel imports totalled to US$ 266.88 million with a growth of 129.39% in 2018 over the corresponding period. Other textile fibre which is second largest commodity imported from Bangladesh totalled to US$ 113.69 million, but perceived a negative growth of 7.35% in 2018 over the corresponding period. Cotton imports have increased marginally by 23.05% to US$ 21.26 million.
Vietnam, which was the fourth largest supplier to India in 2017 has increased its T&C imports to India by 24.50% in 2018 to US$ 299.9 million and now stands as the third largest supplier of T&C goods to India.
The country shares 4% in the total T&C imports of India. From Vietnam, man-made filament is largest commodity imported to India.
The imports of the commodity totalled to US$ 112.11 million with marginally growth of 0.84% in 2018 over the corresponding period. Cotton imports have perceived an outstanding growth of 571.21% to US$ 11.47 million in 2018. Textile fabrics too have perceived an exceptional growth of 168.15% to US$ 40.80 million in 2018.
India's T&C imports from Australia have dropped in 2018 by 18.74% to US$ 256.53 million over the corresponding period mainly due to drop in cotton imports, which registered a drop of 59.29% to US$ 57.50 million in 2018, whereas in the corresponding period the imports registered to US$ 141.25 million.
Australia lost its position by one, now standing as the fourth largest supplier to India for T&C goods. From Australia wool is the commodity majorly imported to India and ruling the import basket with a growth of 11.87% to US$ 202.96 million in 2018 over the corresponding period, where the imports totalled to US$ 181.42 million.
Imports from Indonesia too have witnessed a positive trend and demands have increased for T&C goods especially for MMSF.
The imports from the country to India totalled to US$ 232.48 million with a growth of 61.87% in 2018 over corresponding period and share a stake of 3% in the total T&C imports of India. Here manmade staple fibre is largest imported commodity to India with total imports of US$ 141.32 million with a growth of 100.60% in 2018 over the corresponding period.
Man-made filament import too have increased and is growing moderately y-o-y. The imports of MMF in 2018 witnessed a growth of 34.86% to US$ 36.09 million over the corresponding period. The other commodities to have perceived a positive trend on the import trade and is growing steadily.
The other top suppliers are Thailand, Taiwan, Hong Kong, and Egypt respectively. In 2017 Egypt stood as the 17th largest supplier to India, but is now among the top 10 suppliers list. Imports from Egypt totalled to US$ 160.57 million with a growth of 191.57% in 2018 over the corresponding period. Man-made staple fibre is ruling the import basket and perceived a growth of 50004.16% to US$ 80.72 million in 2018 over the corresponding period where the imports totalled to US$ 0.16 million. Cotton is second largest commodity to be imported with an value of 59.56% to US$ 76.03 million in 2018.
India's demand for world's cotton witnesses a fall
India's cotton imports have witnessed a drop by 27.52% to US% 844.97 million in 2018 over the corresponding period and the commodity stakes 12% share in the total T&C imports of India 2018. While in 2017, the commodity witnessed a positive growth of 8.35% to US$ 1165.76 million over the corresponding period. USA is the largest cotton supplier to India with import value of US$ 356.60 million, but perceived a negative growth of 25.74% in 2018 over the corresponding period.
Under this commodity, foreign cotton of all staple lengths has been imported the most from the world to India. The imports totalled to US$ 624.98 million with a growth of 35.26% in 2018 over the corresponding period and total quantity of 269775.15 Kgs of the commodity was imported to India. On an average, foreign cotton of all staple lengths was imported at an average price of US$ 0.43 per kg in 2018 while in 2017 it was US$ 0.46 per kg.
Cotton sarees of handloom have done well in 2018 imports. The imports of commodity totalled to US$ 12.53 million with growth of 39.63% over the corresponding period. Around 7271.22 sq. metres of saree of handloom was imported to India from the world in 2018 and on average the commodity was trade at US$ 0.58 per sq. metre in 2018, while in 2017 it was US$ 0.33 sq. metre.
Woven apparel imports up 63.53%
India's imports of woven apparel have registered a growth of 63.53% to US$ 609.61 million in 2018 over the corresponding period and the commodity accounts for 8% share in the total T&C imports of India. Bangladesh is the largest supplier of woven apparel to India, the imports of the commodity from Bangladesh totalled to US$ 266.88 million with growth of 129.39% in 2018. China is the second largest supplier of woven apparels to India, has lost it exports value to India by 1.36% to US$ 110.03 million in 2018 over the corresponding period.
Under this commodity, trousers and shorts made of cotton for men have been imported the most to the country from the world. The import value totalled to US$ 132.80 million with a growth of 64.86% in 2018 over the corresponding period. As per the statistics provided by the government, India imported around 26058 nos. of trousers and shorts from the world in 2018 and on average the product was traded in country at price of US$ 0.20 per piece, while in 2017 it was traded at US$ 0.34 per piece. While imports trousers and shorts made of synthetic fibre registered a splendid growth of 115.66% in 2018 to US$ 17.53 million over the corresponding period.
The quantity of this products increased by 122.99% in 2018 with a quantity of 2156 nos while in 2017 with was 967 nos. and on a average the product was imported to India at US$ 0.12 per piece in 2018 and 2017 too.
Men's shirts made cotton too have witnessed an excellent trend in the import segment, with a growth of 148.70% to US$ 90.65 million in 2018 over the corresponding period. The quantity of this product in 2018 has nearly gone up more than thrice the quantity that was imported in 2017. In 2018 imported quantity registered to 13222 nos., while in 2017 it was registered to be at 4099. Men's shirt made of cotton on average was traded at a price of US$ 0.15 per piece in 2018 while in 2017 it was traded at US$ 0.11 per piece.
Knit apparels imports up 41.54%
Imports of knit apparel to have witnessed a rise in 2018 by 41.54% to US$ 447.97 million over the corresponding period and commodity stakes 6% share in the total T&C imports of India. For knit apparels, China is the largest supplier to India with a growth of 28.52% to US$ 205.93 million in 2018. Indian buyers have been demanding for knitted apparels from Bangladesh, the imports from Bangladesh have increased by 85.36% in 2018 to US$ 76 million in 2018 over the corresponding period. Demands from Sri Lanka too have shown interesting trend in the import segment, the import from country to India registered a growth of 84.63% to US$ 28.81 million in 2018.
Under this commodity, t-shirt made of cotton have been largely supplied to India from the world, the imports of this commodity totalled to US$ 42.26 million with a growth of 36.16% in 2018 over the corresponding period.
Quantity wise the product has not jumped that high, in 2018 the quantity registered was 25558 nos while in 2018 with was 19232. On a average, t-shirt of cotton was trade at price of US$ 0.60 per piece while 2017 it was US$ 0.62 per piece.
T-shirt made of other textile material like synthetic fibre, artificial fibre, silk, wool and other textile fibre to have done well in the import segment. For Synthetic fibre the imports registered to US$ 19.18 million with a growth of 31.32%, while for artificial fibre the imports registered to US$ 3.39 million with growth of 40.6%.
For t-shirt made of silk imports totalled to US$ 0.02 million with an growth of 191.46% and for wool it was US$ 0.1 million with a growth of 342.37% and last of other fibres with imports totalled to US$ 7.3 million with growth of 24.76% in 2018 over the corresponding period.
In 2018 imports of babies garments made of cotton have witnessed an import of double the value that was registered in 2017. Last year imports totalled to US$ 14.41 million with a growth of 100.34% over the corresponding period.
In total around 2049 nos. of babies garment were imported from world to India. On average a garment was imported to India at rate of US$ 0.14 per piece in 2018 while in 2017 it was traded at US$ 0.20 per piece.
Other hosiery goods of synthetic fibres imports have registered an enormous growth of 456.07% in 2018 to US$ 8.54 million over the corresponding period. Quantity wise the commodity has been heavily imported to the country, it has witnessed a growth of 3586.36% in 2018 with quantity of 52542 pairs while in 2017 it was registered to be 1425 pairs that was imported to the country. On an average, the product was imported at a price of US$ 6.15 per pair in 2018, while in 2017 it was US$ 0.93 for a pair.
 Wool import from Australia rises
Wool imports have registered a marginal growth of 10.26% in 2018 to US$ 384.34 million over the corresponding period. The commodity accounts of 5% share in the total T&C imports of India.
For wool imports, Australia is the largest supplier to India, the imports totalled to US$ 202.96 million with growth of 10.26% in 2018 over the previous year and its stakes 53% share in the total imports of wool to India from the world. Wool imports of New Zealand registered a fall in exports of wool to India by 13.15% in 2018 over the corresponding period.
Under this commodity, wool, greasy including fleece washed other than shorn wool was imported the most to India from the world. The imports of this commodity totalled to US$ 214.64 million with a growth of 9.87% in 2018 over the corresponding period, but the quantity of the product has reduced marginally by 5.7% to 34653.94 kgs in 2018, while in 2017 it was 35010.52 kgs. On a average the product was traded to US$ 0.16 per kg to India in 2018, while in 2017 it was traded at US$ 0.18 per kg.
Silk imports have dropped in 2018
The silk imports have witnessed a declined trend of 17.10% to US$ 208.09 million in 2018 over the corresponding period and shares 3% in the total T&C imports of India. China is the main supplier of silk to India, but imports from China have gone down by 30.79% to US$ 135.48 million in 2018 over the corresponding period.
Vietnam which stands as the second largest supplier to India for silk goods, has witnessed an increase in its demands from India. The imports from Vietnam registered a growth of 52.45% in 2018 to US$ 65.47 million over the previous year.
Under silk, Mulberry raw silk was imported the most the country in 2018, the imports of mulberry raw silk totalled to US$ 86.70 million, but perceived a negative growth of 14.42% over the corresponding period. On average mulberry raw silk was imported at price of US$ 0.02 per kg from the world to India in 2018 and 2017. Quantity wise the product too have witnessed a drop of 25.79% in 2018 with a quantity of 1509.29 kg, while 2017 the quantity was 2033.81 kgs.
Silk waste too has witnessed an increase in its imports by 105.37% to US$ 1.14 million in 2018 over the corresponding period where the imports totalled to US$ 0.55 million.
Man-made filament imports increase marginally
MMF imports to India have increased by 15.27% to US$ 937.16 million in 2018 over the corresponding period where the imports totalled to US$ 812.92 million. The commodity stakes 13% share in the total T&C imports of India. Here China is largest supplier to India, with an import value of US$ 421.33 million and growth of 19% in 2018 over the corresponding period.
Under MMF, elastomeric yarn was majorly imported product to India with an import value of US$ 133.43 million and growth of 16% in 2018 over the previous year and the quantity imported to India registered to 22211.80 kgs. Elastomeric was traded at price of US$ 0.17 per kg in 2018 and 2017 too.
MMSF import rise
Imports of MMSF have been high in demand, especially from Indonesia and Egypt. The Imports of the product to India from world totalled to US$ 924.15 million with growth of 41.71% in 2018 over the corresponding period.
China is the supplier of MMSF, but the demands to China from India have remained stagnant with growth of 7.99% to US$ 303.74 million in 2018. Interestingly demands from Indonesia and Egypt have increased in a year's time. From Indonesia, the imports witnessed an increase of 100.6% to US$ 141.32 million in 2018, while Egypt has witnessed an increase 50004% to US$ 80.72 million in 2018 over the corresponding period where the imports totalled to US$ 0.16 million.
Under this category, staple fibre of polyester not carded or combed was majorly imported to the country from the world. The import value registered a growth of 10.58% to US$ 116.47 million in 2018 over the corresponding period. But quantity wise the product witnessed a fall by 8.73% to 83285.55 kgs in 2018 over the corresponding period where the quantity totalled to 91248.08 kgs. On a average staple fibre of polyester was traded at a price of US$ 0.72 per kg in 2018 while in 2017 the product was trade at US$ 0.87 per kg.
Viscose rayon spun yarn imports from world to India registered a growth of 600% to US$ 37.52 million in 2018 over the previous year where the imports totalled to US$ 5.36 million and quantity totalled to 13272.29 kgs in 2018 while in 2017 it totalled to 1971.56 kgs. Viscose rayon spun yarn was imported to the country at a price of US$ 0.35 per kg in 2018 while in 2017 the product was traded at a price of 0.37 per kg.
Nonwoven imports have been rising steadily in the last 8 years
Nonwoven imports have been rising y-o-y and in 2018 the commodity have registered a growth of 15% to US$ 358.24 million in 2018 over the corresponding period and shares 5% in the total T&C imports of India.
China is the leading supplier to India for nonwoven products, registering an import value of US$ 118.31 million with growth of 26.84% in 2018 and it stakes 33% in the total Nonwoven imports of India. Imports from Italy have suddenly staked up by 197.52% to US$ 12.83 million in 2018 over the previous year where the imports of nonwoven was US$ 4.31 million.
Here, man-made filament weighing more than 25G/SqM is imported the most under this commodity to India. The imported of this product totalled to US$ 61.96 million with growth of 1.52% in 2018 over the corresponding period. Quantity of the product has reduced by 4.71% to 23836.81 kgs in 2018 over 24874.28 kgs in 2017. On a average the product was import at US$ 0.38 per kg in 2018, while in 2017 it was traded at US$ 0.41 per kg.
Imported textile floor coverings has small, but growing market in India
Carpets and other textile floor covering which shares 2% in the total T&C imports of India, has been gradually growing y-o-y though the market is small for the product. The imports registered to US$ 122.94 million with growth of 18.75% in 2018 over the corresponding period where the imports totalled to US$ 103.53 million in 2017.
For this commodity too, China is the major supplier to India. China's carpets and other textile floor coverings totalled to US$ 37.73 million in 2018 with growth of 18.75% over the corresponding period. Imports from Thailand and Turkey too are showing interesting trend, both the country's exports to India have increased by 19.52% and 58.75% respectively in 2018.
Here other mats and mattings product is the majorly imported product under the category and the imports totalled to US$ 45.09 million in 2018, but perceived a negative growth of 1.81% over the corresponding period. On an average, the product was imported at rate of US$ 0.07 per sq. meter in 2018, while in 2017 it was traded at US$ 0.06 per sq. meter. The Quantity witnessed an increase of 2.51% to 3013.09 sq. meters.
Other textile floor covering of other man-made textile material too witnessed an increase in its imports to India. The products imports totalled to US$ 26 million with a growth of 52.2% in 2018 over the corresponding period and the product on an average was traded at price of US$ 0.23 per sq. meter in 2018 while in 2017 it was US$ 0.21 sq. meter.
Knitted fabric imports up 4.9%
Knitted fabrics which share 8% in the total T&C imports of India have registered a minimal growth of 4.9% to US$ 577.01 million in 2018 over the corresponding period. Here to China is top supplier to India, the import value totalled to US$ 431.15 million with a growth of 3.31% in 2018 over the previous year.
Vietnam has done in India import market for Knitted fabrics, the imports of the same totalled to US$ 6.52 million with growth of 210.10% in 2018 over the corresponding period.
Under this commodity, other knitted or crocheted fabrics of synthetic fibres dyed was imported the most of India.
The import of the commodity totalled to US$ 149.9 million, but perceived a negative growth of 30.61% in 2018 over the corresponding period. The quantity dropped by 32.74% in 2018 to 53882.31 kgs over the corresponding period where the quantity totalled to 80110.09 kgs and on a average the commodity was traded at price of US$ 0.36 per Kg in 2018 while 2017 the commodity was traded at US$ 0.37 per kg.
Another product under this commodity, other knitted or crocheted fabric of cotton dyed have witnessed a growth of 196.64% to US$ 31.11 million in 2018 over the corresponding period. This product was traded at a price of US$ 0.31 per kg in 2018, while in 2017 it was traded at US$ 0.30 per kg.
Other T&C commodities import summary
The other textile fibres commodity which stakes 4% share in the total T&C imports of India registered a growth of 5% to US$ 327.30 million in 2018 over the corresponding period. Bangladesh is the top supplier of this product, and the import value totalled to S$ 113.96 million, but perceived a negative growth of 7.35% in 2018 over the previous year.
Flax yarn single not up of retail sales was imported the most under this commodity with an import value of US$ 60.11 million and growth of 4.47% in 2018 over the previous year. The product was traded at US$ 0.11 per kg in 2018, while the product was traded at US$ 0.13 kg in the corresponding period.
Woven fabrics imports have gone up by marginally by 2.55% in 2018 to US$ 203.88 million over the corresponding period and commodity shares 3% in the total T&C imports of India. Here to China is the main supplier with import value of US$ 85.23 million in 2018, but perceived a negative growth of 0.42% over the corresponding period.
Imports from Sri Lanka have increased by 29.89% to US$ 12.37 million. Here other narrow woven fabric containing by weight 5% or more of elastomeric yarn or rubber thread was imported majorly under this commodity, the products imports totalled to US$ 29.81 million with growth of 11.55% in 2018 over the corresponding period and the product was traded at US$ 0.09 per kg in 2018 while in 2017 it was US$ 0.07 per kg.
Also Read: India's T&C Exports Remain Sluggish In 2018
Wool import from Australia rises
Wool imports have registered a marginal growth of 10.26% in 2018 to US$ 384.34 million over the corresponding period. The commodity accounts of 5% share in the total T&C imports of India.
For wool imports, Australia is the largest supplier to India, the imports totalled to US$ 202.96 million with growth of 10.26% in 2018 over the previous year and its stakes 53% share in the total imports of wool to India from the world. Wool imports of New Zealand registered a fall in exports of wool to India by 13.15% in 2018 over the corresponding period.
Under this commodity, wool, greasy including fleece washed other than shorn wool was imported the most to India from the world. The imports of this commodity totalled to US$ 214.64 million with a growth of 9.87% in 2018 over the corresponding period, but the quantity of the product has reduced marginally by 5.7% to 34653.94 kgs in 2018, while in 2017 it was 35010.52 kgs. On a average the product was traded to US$ 0.16 per kg to India in 2018, while in 2017 it was traded at US$ 0.18 per kg.
Silk imports have dropped in 2018
The silk imports have witnessed a declined trend of 17.10% to US$ 208.09 million in 2018 over the corresponding period and shares 3% in the total T&C imports of India. China is the main supplier of silk to India, but imports from China have gone down by 30.79% to US$ 135.48 million in 2018 over the corresponding period.
Vietnam which stands as the second largest supplier to India for silk goods, has witnessed an increase in its demands from India. The imports from Vietnam registered a growth of 52.45% in 2018 to US$ 65.47 million over the previous year.
Under silk, Mulberry raw silk was imported the most the country in 2018, the imports of mulberry raw silk totalled to US$ 86.70 million, but perceived a negative growth of 14.42% over the corresponding period. On average mulberry raw silk was imported at price of US$ 0.02 per kg from the world to India in 2018 and 2017. Quantity wise the product too have witnessed a drop of 25.79% in 2018 with a quantity of 1509.29 kg, while 2017 the quantity was 2033.81 kgs.
Silk waste too has witnessed an increase in its imports by 105.37% to US$ 1.14 million in 2018 over the corresponding period where the imports totalled to US$ 0.55 million.
Man-made filament imports increase marginally
MMF imports to India have increased by 15.27% to US$ 937.16 million in 2018 over the corresponding period where the imports totalled to US$ 812.92 million. The commodity stakes 13% share in the total T&C imports of India. Here China is largest supplier to India, with an import value of US$ 421.33 million and growth of 19% in 2018 over the corresponding period.
Under MMF, elastomeric yarn was majorly imported product to India with an import value of US$ 133.43 million and growth of 16% in 2018 over the previous year and the quantity imported to India registered to 22211.80 kgs. Elastomeric was traded at price of US$ 0.17 per kg in 2018 and 2017 too.
MMSF import rise
Imports of MMSF have been high in demand, especially from Indonesia and Egypt. The Imports of the product to India from world totalled to US$ 924.15 million with growth of 41.71% in 2018 over the corresponding period.
China is the supplier of MMSF, but the demands to China from India have remained stagnant with growth of 7.99% to US$ 303.74 million in 2018. Interestingly demands from Indonesia and Egypt have increased in a year's time. From Indonesia, the imports witnessed an increase of 100.6% to US$ 141.32 million in 2018, while Egypt has witnessed an increase 50004% to US$ 80.72 million in 2018 over the corresponding period where the imports totalled to US$ 0.16 million.
Under this category, staple fibre of polyester not carded or combed was majorly imported to the country from the world. The import value registered a growth of 10.58% to US$ 116.47 million in 2018 over the corresponding period. But quantity wise the product witnessed a fall by 8.73% to 83285.55 kgs in 2018 over the corresponding period where the quantity totalled to 91248.08 kgs. On a average staple fibre of polyester was traded at a price of US$ 0.72 per kg in 2018 while in 2017 the product was trade at US$ 0.87 per kg.
Viscose rayon spun yarn imports from world to India registered a growth of 600% to US$ 37.52 million in 2018 over the previous year where the imports totalled to US$ 5.36 million and quantity totalled to 13272.29 kgs in 2018 while in 2017 it totalled to 1971.56 kgs. Viscose rayon spun yarn was imported to the country at a price of US$ 0.35 per kg in 2018 while in 2017 the product was traded at a price of 0.37 per kg.
Nonwoven imports have been rising steadily in the last 8 years
Nonwoven imports have been rising y-o-y and in 2018 the commodity have registered a growth of 15% to US$ 358.24 million in 2018 over the corresponding period and shares 5% in the total T&C imports of India.
China is the leading supplier to India for nonwoven products, registering an import value of US$ 118.31 million with growth of 26.84% in 2018 and it stakes 33% in the total Nonwoven imports of India. Imports from Italy have suddenly staked up by 197.52% to US$ 12.83 million in 2018 over the previous year where the imports of nonwoven was US$ 4.31 million.
Here, man-made filament weighing more than 25G/SqM is imported the most under this commodity to India. The imported of this product totalled to US$ 61.96 million with growth of 1.52% in 2018 over the corresponding period. Quantity of the product has reduced by 4.71% to 23836.81 kgs in 2018 over 24874.28 kgs in 2017. On a average the product was import at US$ 0.38 per kg in 2018, while in 2017 it was traded at US$ 0.41 per kg.
Imported textile floor coverings has small, but growing market in India
Carpets and other textile floor covering which shares 2% in the total T&C imports of India, has been gradually growing y-o-y though the market is small for the product. The imports registered to US$ 122.94 million with growth of 18.75% in 2018 over the corresponding period where the imports totalled to US$ 103.53 million in 2017.
For this commodity too, China is the major supplier to India. China's carpets and other textile floor coverings totalled to US$ 37.73 million in 2018 with growth of 18.75% over the corresponding period. Imports from Thailand and Turkey too are showing interesting trend, both the country's exports to India have increased by 19.52% and 58.75% respectively in 2018.
Here other mats and mattings product is the majorly imported product under the category and the imports totalled to US$ 45.09 million in 2018, but perceived a negative growth of 1.81% over the corresponding period. On an average, the product was imported at rate of US$ 0.07 per sq. meter in 2018, while in 2017 it was traded at US$ 0.06 per sq. meter. The Quantity witnessed an increase of 2.51% to 3013.09 sq. meters.
Other textile floor covering of other man-made textile material too witnessed an increase in its imports to India. The products imports totalled to US$ 26 million with a growth of 52.2% in 2018 over the corresponding period and the product on an average was traded at price of US$ 0.23 per sq. meter in 2018 while in 2017 it was US$ 0.21 sq. meter.
Knitted fabric imports up 4.9%
Knitted fabrics which share 8% in the total T&C imports of India have registered a minimal growth of 4.9% to US$ 577.01 million in 2018 over the corresponding period. Here to China is top supplier to India, the import value totalled to US$ 431.15 million with a growth of 3.31% in 2018 over the previous year.
Vietnam has done in India import market for Knitted fabrics, the imports of the same totalled to US$ 6.52 million with growth of 210.10% in 2018 over the corresponding period.
Under this commodity, other knitted or crocheted fabrics of synthetic fibres dyed was imported the most of India.
The import of the commodity totalled to US$ 149.9 million, but perceived a negative growth of 30.61% in 2018 over the corresponding period. The quantity dropped by 32.74% in 2018 to 53882.31 kgs over the corresponding period where the quantity totalled to 80110.09 kgs and on a average the commodity was traded at price of US$ 0.36 per Kg in 2018 while 2017 the commodity was traded at US$ 0.37 per kg.
Another product under this commodity, other knitted or crocheted fabric of cotton dyed have witnessed a growth of 196.64% to US$ 31.11 million in 2018 over the corresponding period. This product was traded at a price of US$ 0.31 per kg in 2018, while in 2017 it was traded at US$ 0.30 per kg.
Other T&C commodities import summary
The other textile fibres commodity which stakes 4% share in the total T&C imports of India registered a growth of 5% to US$ 327.30 million in 2018 over the corresponding period. Bangladesh is the top supplier of this product, and the import value totalled to S$ 113.96 million, but perceived a negative growth of 7.35% in 2018 over the previous year.
Flax yarn single not up of retail sales was imported the most under this commodity with an import value of US$ 60.11 million and growth of 4.47% in 2018 over the previous year. The product was traded at US$ 0.11 per kg in 2018, while the product was traded at US$ 0.13 kg in the corresponding period.
Woven fabrics imports have gone up by marginally by 2.55% in 2018 to US$ 203.88 million over the corresponding period and commodity shares 3% in the total T&C imports of India. Here to China is the main supplier with import value of US$ 85.23 million in 2018, but perceived a negative growth of 0.42% over the corresponding period.
Imports from Sri Lanka have increased by 29.89% to US$ 12.37 million. Here other narrow woven fabric containing by weight 5% or more of elastomeric yarn or rubber thread was imported majorly under this commodity, the products imports totalled to US$ 29.81 million with growth of 11.55% in 2018 over the corresponding period and the product was traded at US$ 0.09 per kg in 2018 while in 2017 it was US$ 0.07 per kg.
Also Read: India's T&C Exports Remain Sluggish In 2018
Textile Excellence
Subscribe To Textile Excellence Print Edition
If you wish to Subscribe to Textile Excellence Print Edition, kindly fill in the below form and we shall get back to you with details.
Newsletter
Subscribe To Textile Excellence Mailing List


- December 09, 2022
'There Is Very High Acceptance For India

- December 09, 2022
'Advanced Machines & Service, Customer C

- October 09, 2023
First-time In The World: Rieter’s Auto

- October 31, 2023
Denge & Dyesol India: Leading The Way In

- June 01, 2020
Karl Mayer Enables Automated Production

- June 05, 2023
Ultimax - All New Revolutionary Rapier W

- June 09, 2025