US Home Textiles Imports May Remain Sluggish In 2020
US is the single largest market for India's home textiles, with almost 50% of home textile exports going to this market. US however still sources 50% of its home textiles and made-ups requirements from China. In 2019, at the peak of the US-China trade war, China's share in US made-ups imports was 50.46%, 1.65% lower than in 2018. India supplied 22.45% of US made-ups imports, 1.21% highher than in 2018.
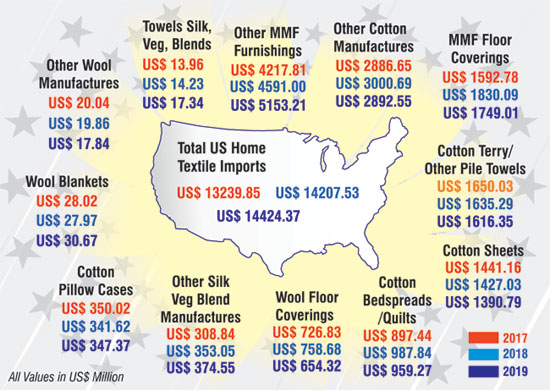
US imports of made-ups and home textiles in 2019 stood at US$ 14424.37 million, 1.52% higher than in 2018. This is a steep fall in growth rate from the previous year.
In 2018, US imports had increased by 7.31% over 2017. US textile & apparel import growth could remain stagnant in 2020 too due to the varied impact of the coronavirus, & the numerous store closures happening in this market.
China, India dominate US home textile imports
Main items of home textile and made-ups imports by the US include cotton terry towels, other cotton manufactures (which includes among others table and kitchen linens, bedspread, curtains, upholstery, etc), cotton sheets, cotton bedspreads and quilts, MMF floor coverings, other MMF furnishings, wool floor coverings. India is the top supplier of cotton sheets, terry towels and wool floor coverings, to the US market. In other important products, China is the lead supplier.
 In cotton sheets, India is the top supplier to the US market, followed by China and Pakistan. In 2019, US imports of cotton sheets fell by 2.54%. India's exports to the US fell by almost 2% to US$ 691.01 million in 2019. In 2018, India's exports of this item to the US had dropped 1.65%.
China is the second largest supplier of cotton sheets to the US, and suffered a setback due to the US-China trade war. China's exports of cotton sheets worth US$ 269.13 million fell 11.57% in 2019, after recording a growth of 3.95% in 2018. Exports from Pakistan grew 10.21% in 2019, while registering a growth of 6.37% in 2018 too.
US imports of cotton bedspreads and quilts fell 2.89% in 2019, to US$ 959.26 million. In 2018, imports had increased by 10.07%. China, top supplier, exported goods worth US$ 557.34 million, down 6.4% in 2019. In 2018, China's exports had registered a growth of 14.68%.
India's exports of US$ 160.05 million grew 10.68% in 2019, a slightly higher growth than 10.59% registered in 2018. Imports from Pakistan, at US$ 152.92 million, fell marginally by 1.62% in 2019. US cotton terry towel imports in 2019 were US$ 1616.345 million, 1.16% lower than in 2018. India exported terry towels worth US$ 636.71 million, a small growth of 0.32%. India accounts for the majority share of 39.39% of total US imports of cotton terry towels.
China enjoys a 23.74% share of US imports of this item. China's exports of US$ 383.77 million, were 5.58% lower than in 2018. Pakistan's exports witnessed a growth of 2.28% to US$ 340.04 million.
US imports from Turkey were up 7.45%, from Colombia 12.36%, from Salvador 17.8% and Jordan 67.91%. Other cotton furnishings and home textiles imports into the US stood at US$ 2892.55 million in 2019, a fall of 3.6% compared to 2018.
Top supplier China did not fare too well last year, with exports falling almost 15% to US$ 1148.62 million. China accounts for 39.71% of total US imports in this category. China witnessed an erosion of its market share from 45% in 2018.
India has a share of 26.8% in this category, up from 25% in 2018. India's exports went up by 3.35% to US$ 775.09 million in 2019. Third supplier Pakistan suffered a fall of 3.5% in exports of the goods, which stood at UUS$ 452.60 million.
US imports from Vietnam were 19.63% higher than in 2018, from Cambodia 239% higher, and from Portugal 22.67% higher than in 2018.
US floor covering imports down
US imports of wool floor coverings fell 13.76% in 2019, to US$ 654.32 million. India's exports of this item worth US$ 378.56 million to the US, was 4.3% lower than in 2018. India is the top supplier of wool floor coverings in the US, accounting for 57.86% share in total US imports.
There was a noticeable improvement in India's share from 52.14% in 2018. China's exports fell 27.86% to US$ 55.94 million. Pakistan's exports of this commodity at US$ 43.38 million showed a marginal growth of 0.49%. MMF floor covering imports into the US amounted to US$ 1749 million, a fall of 4.43% compared to 2018. In 2019, Turkey overtook China to become the top supplier in the US market. Imports from Turkey at US$ 648.61 million increased by 18.37% in 2019.
China's exports at US$ 389.89 were 32.16% lower than in 2018. India maintained its position as the third largest supplier with exports of US$ 187.87 million, 9.75% higher than in 2019. Among emerging sourcing destinations are Mexico , Korea and Vietnam.
China dominates US MMF home furnishings imports
Other MMF home furnishings is the most important item in the US home textiles import basket, accounting for a share of 35% of total home textiles and mad-ups imports.
US imports of MMF furnishings increased 12.22% in 2019 to US$ 5153.20 million. Here China is the dominant supplier with a share of 83.23% of total US imports.
This is the only category where China's exports grew in 2019, by 12.65% to US$ 4288.81 million. India is a far second here, with a share of 1.56% of the US imports; imports from India grew 4.38% to US$ 80.17 million. Pakistan's exports in this category grew 6.37% to US$ 79.26 million.
Among emerging suppliers are Ukraine - US imports from Ukraine have grown exponentially in the last two years; Salvador, Vietnam, among others.

Textile Excellence
If you wish to Subscribe to Textile Excellence Print Edition, kindly fill in the below form and we shall get back to you with details.


