Currency Fluctuations And Textile Exports
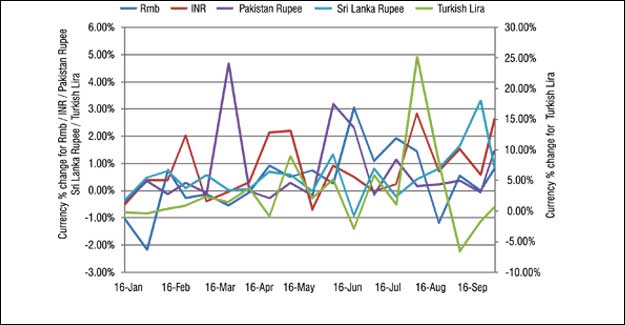
Currencies across the world have depreciated, in a spillover effect, starting probably with the economic crisis in Turkey and Argentina. We look at how currencies have behaved since the beginning of 2018 till date, and the impact this has had on textile exports and imports of the various countries. CNY depreciates 6.36% China's currency since January 2018 has depreciated by over 6%. The value of the remnimbi against the dollar weakened especially since May this year, with a sudden severe weakening of over 4% happening in July. August too witnessed the CNY depreciating by another 2-3%. The currency devaluation is viewed by the US and others as a means to remain competitive amid its trade war with the US. However, the International Monetary Fund has said that the yuan is "broadly in line" with China's economic fundamentals. The IMF says the drop in the yuan reflects the People's Bank of China's commitment to make the exchange rate more flexible. "According to our framework, the exchange rate of the renminbi is not out of line. It is broadly in line with the fundamentals," Markus Rodlauer, deputy director of the fund's Asia and Pacific Department, said. Has this devaluation had an impact on China's textile and apparel trade? China's apparel exports have picked up since May 2018. Textile exports have dropped, on the other hand. The country's cotton yarn imports have been growing during this period. China's textile and apparel exports in the first eight months of 2018 have witnessed steep fluctuations. Textile yarn, fabrics and made-ups exports went up by 3% in August, compared to exports in January, while exports of apparel were 27% higher than in January. In February 2018, textile exports were 10.69% lower than in January, while apparel exports fell 12% in just a month. The fall was steeper in March, when textile exports went down by almost 22%, and apparel exports by over 39%. A sharp turnaround happened in April, when China's textile exports went up by over 50% compared to the previous month, and apparel exports were also 52.44% higher than in March. Exports continued to grow at a slower pace in May, when textile exports were 7.13% higher, and garment exports were 12.09% higher than in April. In May, CNY had begun to depreciate slightly. China's textile exports however, fell by around 5% in June, while apparel exports went up by 23.83% compared to May. CNY also continued to depreciate. Textile exports continued to fall in July by nearly 5%, even as apparel exports climbed 13.44% compared to the previous month. In August, China's textile exports were marginally up by 1.2% compared to July and apparel exports went down by 1.06%. While the US-China trade war has had a dampening effect on China's exports, the progress of BRI has resulted in increased trade between China, Central Asia and Europe. China's textile and apparel exports to the US during January-August 2018 were 4.5% higher than in the same period of 2017. In the first eight months of 2018, China exported 21146.2 million square metres equivalent of textiles and apparel to the US, which is 47.43% of the total textile and apparel imports by the US. China's textile and apparel imports too witnesssed a fluctuating trend. While imports were 37% down in February, they climbed 62% in March, before falling 7.64% in April. In May, imports rebounded by 17.58%, followed by another slump of 8.60%. In July imports went up by 7.45%, and by 3.89% in August. China's cotton yarn imports in August were almost 10% higher than in January. Knit fabric imports were also almost 10% more in August compared to January. Apparel imports climbed almost 30% in August, compared to imports in January. Overall, China's rate of growth of imports was higher than the export growth, despite the currency devaluation. INR weakens 16.47% in 2018 Indian rupee since January 2018 till date has weakened 16.47%. Significant depreciation was witnessed in May, and then from August onwards. Experts believe the flight of foreign funds is the main reason for the rupee depreciation. A devaluation of this extent should translate to better exports, as it makes our goods competitive. However, export data does not reveal this. India's textile and apparel exports in July were 5.82% lower than in January. Exports of woven apparel especially saw a steep drop of 19.43% from January to July. India's textile and clothing exports recorded an increase of 10% in March, when the INR also witnessed a slight devaluation. However, the growth was reversed in April, when exports went down by 10.23%, and further by 0.79% in May. There was a nominal improvement of 0.92% in June, and then a drop of 5.57% in July. In all these months, the Indian rupee was weakening. From January to March, the rupee had depreciated by 2.24%. And by another 2% from March to May. So currency depreciation was not much of a factor for exports to increase, when globally, consumer spending has been subdued, and the currency fluctuations are hedged into price negotiations with buyers. Bangladesh's exports slow down India's strong competitor in the apparel sector, Bangladesh has seen its exports slow down amid its own steady currency rate, and growing price competition due to weakening currencies elsewhere. Bangladesh's textile and apparel exports during April-June were down 0.32% compared to exports during January-March. RMG exports, the largest product category in the segment, declined 0.31% in the second quarter of 2018. Exports of home textiles too fell 6.6% during the period. Exports of jute and jute products saw an improvement of over 2%. Competition from other suppliers, and a slowdown in European and US retail markets are also reasons for the country's export slowdown. Bangladesh's overall textile and clothing imports fell 1.22% during April-June compared with the previous January-March quarter. Turkish lira in free fall, exports fall too Turkey has recorded a devaluation of its lira by as much as 60%. The country is going through an economic crisis. With weak fundamentals, the country's exports and imports have been impacted. Which in turn has had a spiralling effect on countries supplying to Turkey. For instance, India's polyester yarn exports to Turkey, its largest market for the commodity, have almost come to a standstill, resulting in overcapacity in its domestic market. Turkish lira has severely weakened during January-August, by over 60% in the face of economic depression. The currency weakening may have helped Turkey's exports to stay at the current levels, instead of falling even further. However, there is a clear slowdown in exports from the textile and apparel manufacturing hub. In August, Turkey's textile and clothing exports went down by 5%, compared to exports in January 2018. Export growth has fluctuated wildly during these eight months. Exports went up by almost 18% in March, as the lira depreciated by almost 3% from January. However, in April, exports saw a drop of 12%, even as the currency had weakened by over 8% since January. There was a slight pick-up in May exports by 2.22%. By this time, the lira had weakened by over 16% compared to January. Exports fell in June by 10%, and increased by 13.40% in July. In August, exports again fell by 12.28%. In August, the lira had lost 62% of its value. Clearly, economic fundamentals were not supportive of industrial growth. Currency depreciation alone cannot boost exports. Turkey's textile imports too are showing a mixed trend, even as a slowdown is obvious. Textile and apparel imports in August were 22.57% lower than in January this year. Turkey's three main items of textile imports - cotton and cotton textiles, MMF textiles and manmade staple fibre textiles have recorded steep falls of 14%, 31% and 29% respectively in August, compared to January. A stable dong helps Vietnam's exports rise 24.47% in August The Vietnam dong has remained quite stable, with a devaluation of around 2.45% from January to October. Vietnam is an important player in the apparel sector. And the devaluation will help it improve its position a little more. Textile and apparel exports during the first eight months of 2018 have been mostly positive. Exports in August were 24.47% higher than in January. Main item of exports - apparel grew 27% during this time, while fabric exports went up by 34.31%. Yarn exports were up by around 4%. Vietnam's textile imports fell 0.15% in August, compared to January. Imports of cotton were up 11.56%, of yarn by almost 11%. Fabric imports were down 5.06% during this time. Fabric imports account for over 65% of the country's total textile imports, followed by cotton at around 19% and yarns account for the rest. Pakistan exports register robust growth Pakistan's currency from January-October has depreciated by 13.32%. Pakistan's textile and apparel exports have increased 15.85% in August, compared to January this year. Exports of most of the country's important textile product categories have shown robust growth, except readymade garments which fell 3.84% during these months. Monthwise analysis of export data reveals that in August exports had recorded a robust growth of 25.55% over July. Raw cotton exports shot up by 165.37% in August compared to July. Cotton fabric exports went up by 40.47%, knitwear exports were up 34%, made-ups exports were up by over 50% compared to exports in July. However, exports of apparel, which account for over 21% of total textile exports of Pakistan, has shown a subdued growth of 6.15% in August. In July RMG exports had gone down by 10.38% compared to June exports. China, Bangladesh, India, Vietnam are strong contenders in this segment. Pakistan's textile and clothing industry is plagued with a number of chronic problems - lack of infrastructure and government support, political instability, which has made the industry uncompetitive. With Turkey vacating some space in textile supplies, Pakistan can hope to gain some leverage, especially as its currency has made exports a little more attractive. Pakistan's textile and clothing imports registered a fall in most of the months from January to August this year. In August, textile imports went down by 36.31% compared to January. Cotton imports fell as much as 83.63%. Import of synthetic fibres was down 13.82%. Weak imports reflect not just on the weak Pakistani rupee, but also on the weak fundamentals of the textile industry, which has reduced its imports of its raw materials. Pakistan's textile and garment industry has been going through tough times for some time now in the absence of supporting infrastructure and policies. A 13.52% devaluation of its currency seems to have bought some respite for the exports sector, the devaluation will happen further as the country opts for an early IMF loan in the face of growing GDP debt. SL apparel exports rise 6% during Jan-August The Sri Lankan rupee too has depreciated by over 11% in 2018. The SL rupee lost its strength in October mainly. Sri Lanka is known for its exports of high value apparel and lingerie, and has positioned itself as a sustainable producer of apparel, thus making a niche in the world market, and removing itself from commodity price competition to some extent. The country's apparel exports in August were 6% higher than in January. March recorded the highest exports at US$ 465 million. While in April, at US$ 323 million, Sri Lanka's apparel exports were the lowest. Cambodia's stable riel helps keep apparel exports on track Cambodia's riel has remained fairly stable in 2018. A low cost producer, the country's exports in riel terms, have shown a growth of 16.18% in the first half of 2018, compared to the same period of 2017. Cambodia's exports during April-June 2018 recorded a growth of 8.92% over the previous quarter of the year. In terms of dollars, Cambodia's apparel exports during the first quarter of 2018 were around US$ 2.10 billion, which went up by 7.13% to US$ 2.25 billion in the second quarter. Imports of garment materials and inputs needed for apparel manufacturing have also grown during 2018. In terms of riel, during January-June 2018, imports grew 28% compared to the same period of 2017. During April-June 2018, imports were 18.11% higher than during January-March. Imports in dollar terms grew 23.23% during the second quarter of 2018, to US$ 1.15 billion. Myanmar, Cambodia could face EU sanctions Myanmar's kyat too lost its value by as much as 16% since the beginning of January. Since May, its currency has devalued by almost 18%. While this may, to some extent, help its burgeoning RMG sector, the country is faced with sanctions, and economic weakness. A mere currency devaluation will not help the growth of its RMG exports. According to the country's commerce ministry, RMG exports in the first half of 2018 have touched US$ 2.2 billion. The European Union may impose trade sanctions on and remove trade preferences for Cambodia and Myanmar, in a toughening of EU policy on human rights in Southeast Asia. The EU warned Cambodia in July that it could lose its special trade status after elections returned a strongman to power after 30 years in office, and it has censured Myanmar over its treatment of the Muslim Rohingya. However, the European Commission, which handles EU trade policy, is torn between supporting the development of Myanmar's oil-and-textile economy and sanctioning the country. The EU will send a fact-finding mission to Myanmar in the coming days, likely lasting up to four days, to see the extent of the rights abuses and the government's willingness to change course, one EU official said. "There is a clear possibility that a withdrawal (of EU trade preferences) could be the outcome," EU's trade chief, Cecilia Malmstrom later wrote in a blog post on the European Commission's website. Government spokesman Zaw Htay said removing the trade preferences would lead to job losses in the country's garment sector. The EU's Malmstrom said she had told Cambodia that the bloc had launched a six-month review of its duty-free access to the EU, meaning Cambodian sugar, garments and other exports could face tariffs within 12 months under EU rules. "I have notified Cambodia today that we will launch the procedure for withdrawal of EBA," said Malmstrom, referring to the bloc's "Everything but Arms" (EBA) status, which allows the world's poorest countries to sell any goods tariff-free into the EU, except weapons. Cambodia's exports to the European Union were worth 5 billion euros (US$ 5.8 billion) last year, according to EU data, up from negligible levels less than a decade ago, with the EU using its trade policy to develop the country's economy. EU countries accounted for around 40% of Cambodia's foreign sales in 2016. The bulk of those exports were from clothing factories that employ around 700,000 workers.
Textile Excellence
Subscribe To Textile Excellence Print Edition
If you wish to Subscribe to Textile Excellence Print Edition, kindly fill in the below form and we shall get back to you with details.
Newsletter
Subscribe To Textile Excellence Mailing List


- December 09, 2022
'There Is Very High Acceptance For India

- December 09, 2022
'Advanced Machines & Service, Customer C

- October 09, 2023
First-time In The World: Rieter’s Auto

- October 31, 2023
Denge & Dyesol India: Leading The Way In

- June 01, 2020
Karl Mayer Enables Automated Production

- June 05, 2023
Ultimax - All New Revolutionary Rapier W

- June 09, 2025